




MongoDB, Inc. stock dropped sharply after a beat-and-raise quarter, closing at 434.21 despite strong fiscal Q2 2027 results. The wide intraday range from 448.68 to 430.52 signals a market that had already priced in perfection.
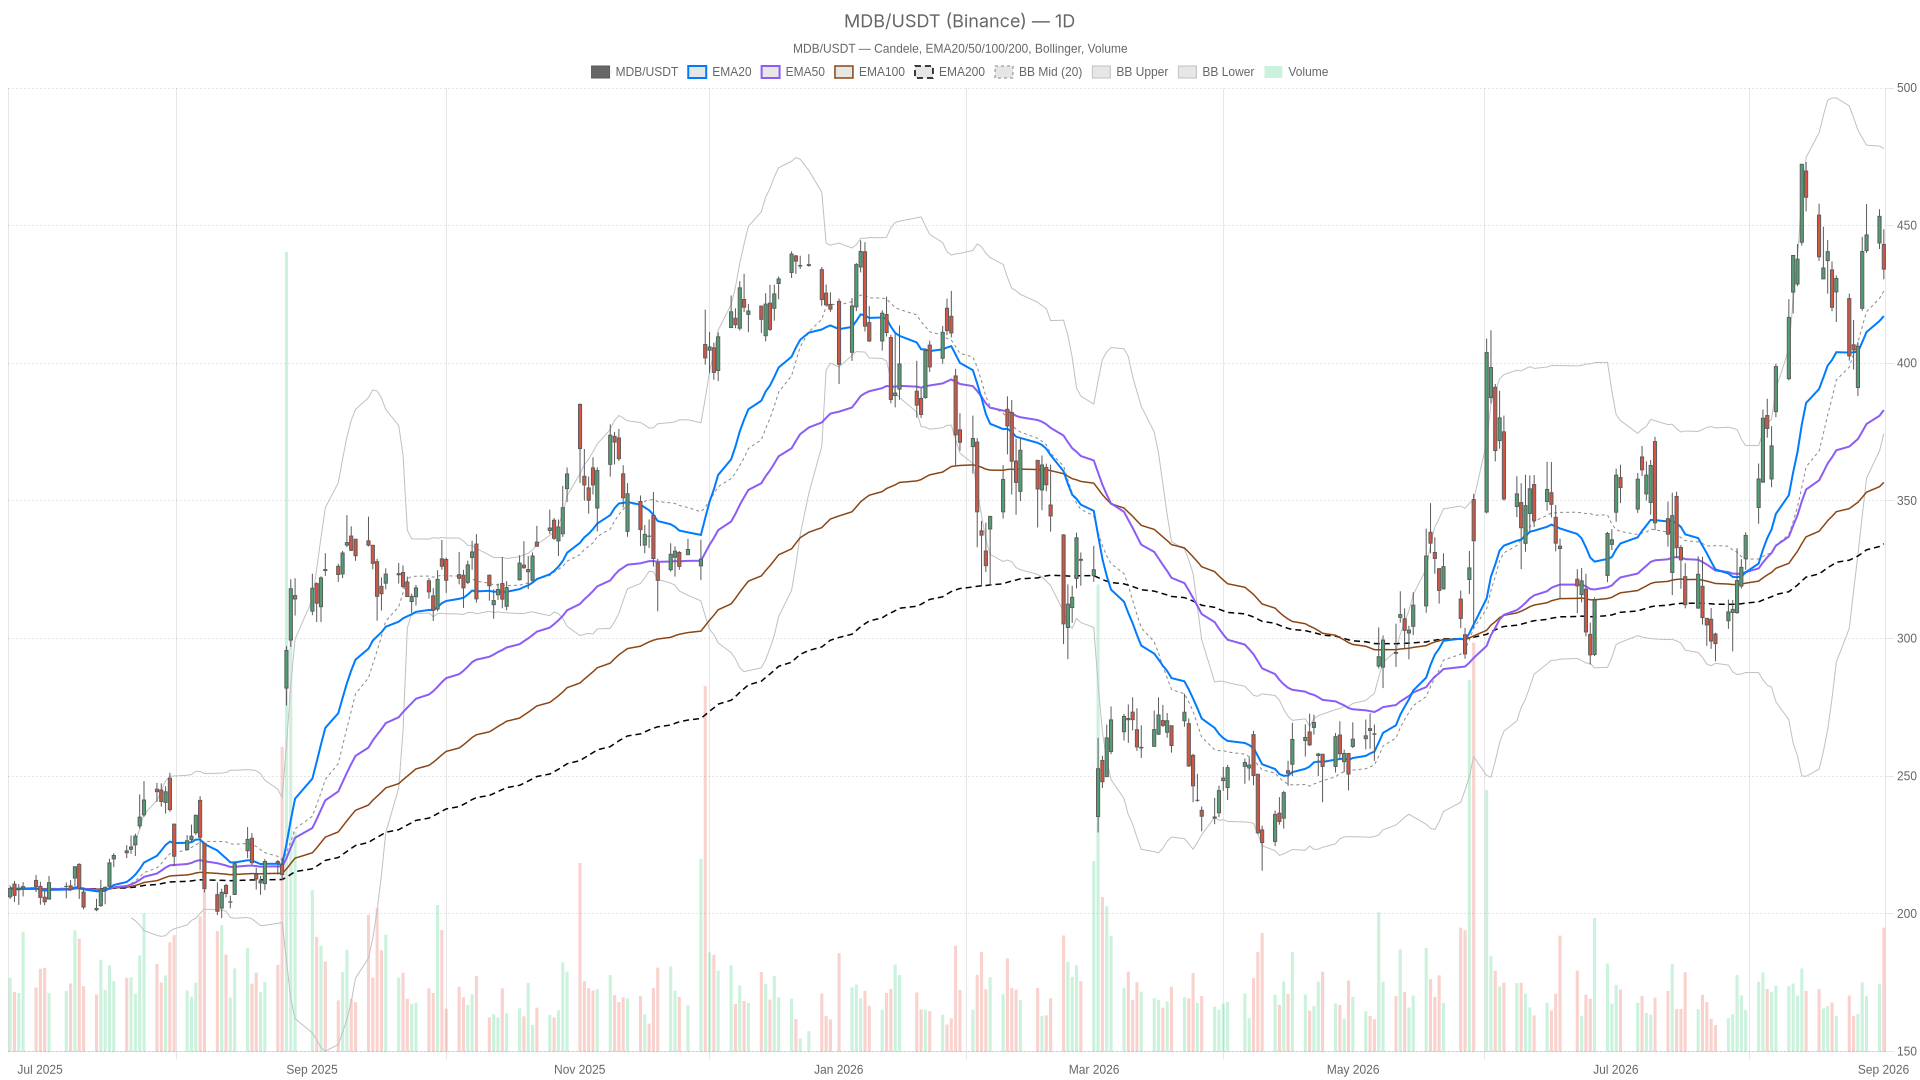
Summary
Key takeaways
- MongoDB reported Q2 fiscal 2027 revenue of $772 million, up 30% year-over-year.
- Full-year revenue guidance raised to between $2.99 billion and $3.03 billion.
- Daily trend remains bullish with price above all three key EMAs.
- Daily RSI of 57.78 signals neutral momentum, while the MACD histogram turns negative.
- Critical support sits at 426.93; the resistance cluster spans the 437–439 zone.
MDB Stock Price Structure: Daily Uptrend Still Intact, But Cracking
The daily uptrend remains structurally intact for MongoDB, Inc. stock, yet early cracks are emerging after Tuesday’s post-earnings selloff.
EMA Stack Confirms Broader Trend
Price continues to trade above all three key EMAs. The 20-day EMA sits at 417.17, the 50-day at 383.03, and the 200-day at 334.47. This stacked structure is the hallmark of an established uptrend. It explains why the daily regime still reads as bullish. However, the size of Tuesday’s pullback deserves attention. Price closed near the daily pivot of 437.81, just above the first support at 426.93. This shows sellers took real control after the earnings release.
Momentum Indicators Flash Caution
The daily RSI reading of 57.78 is telling. It sits in neutral-to-bullish territory, neither overbought nor weak. That leaves room for further selling without becoming technically oversold. Meanwhile, the MACD tells a more cautious story. The MACD line at 20.15 remains below its signal line of 21.73. The resulting histogram reads -1.59. In plain terms, upward momentum on the daily chart is fading. Yet the broader trend structure has not broken.
Volatility Expands Around Earnings
Bollinger Bands add context to the volatility spike. The bands sit at 374.48 on the lower side and 478.02 on the upper side. The midline rests at 426.25. Price closed just above that midline after touching the upper band earlier in the session. This suggests the initial earnings pop was rejected. The daily ATR of 22.49 confirms elevated volatility around the event.
1H Timeframe: Short-Term Momentum Has Turned Neutral
Short-term momentum for MongoDB, Inc. stock has turned decisively neutral on the hourly chart, though the broader intraday trend has not reversed outright.
EMA Positioning Reflects Mixed Signals
Price at 435.29 sits below the 20-hour EMA of 439.21. However, it remains above the 50-hour EMA at 433.64 and the 200-hour EMA at 405.91. This positioning is mixed. Short-term momentum has clearly stalled. Yet the broader hourly trend has not reversed. The 1H RSI of 47.16 sits just under the neutral 50 line. Buyers and sellers appear balanced rather than one side controlling the action.
Hourly MACD Deepens Bearish Tilt
Meanwhile, the hourly MACD paints a more bearish picture. The MACD line at 1.48 sits well below its signal at 3.95. The histogram reads -2.47, a wider negative gap than on the daily chart. Intraday momentum has deteriorated faster than the longer-term trend. This is consistent with a post-earnings digestion phase rather than a full reversal. Price also trades near the lower Bollinger band. The band spans 431.84 to 455.74 around a midline of 443.79. Positioning near the lower band typically reflects short-term downside pressure.
Overall, the 1H regime is classified as neutral, and that captures the conflict well. The daily chart says uptrend. The hourly chart says momentum has cooled. This is not necessarily a contradiction. Strong trends often pause and consolidate after a volatility event like earnings. The hourly weakness looks more like digestion than a structural break.
15-Minute Execution Context
The 15-minute chart for MongoDB, Inc. stock reveals a classic short-term chop pattern, with early stabilization signals emerging after the recent slide.
On the 15-minute chart, price closed at 435.29, up from an intrasession low of 431.26. The EMA20 at 437.48 and EMA50 at 440 both sit above current price. The EMA200 at 433.98 sits just below it. This is a textbook short-term chop setup. The 15m RSI of 43.2 leans mildly weak. However, the MACD histogram has just turned marginally positive at 0.13. This hints at an early attempt to stabilize. Traders watching for short-term entries should note nearby pivot resistance at 436.76 and support at 432.54. Both levels sit close to current price and will likely define the next few hours of trading.
The Bullish Case for MongoDB, Inc. Stock
The bullish case for MongoDB, Inc. stock rests on strong fundamentals and an intact daily uptrend structure that has not been broken by the post-earnings selloff.
The fundamental backdrop still supports the bulls. MongoDB reported second-quarter revenue of $772 million, up 30% year-over-year. Growth in its Atlas cloud database platform and Enterprise Advanced offering both accelerated. The company raised its full-year outlook. It now projects fiscal 2027 revenue between $2.99 billion and $3.03 billion. Atlas growth outlook was lifted to roughly 27%. These are not weak numbers by any measure.
Therefore, if price holds above daily support at 426.93 and reclaims the hourly EMA20 near 439.21, the broader uptrend could reassert itself quickly. A recovery toward the daily pivot at 437.81 and then R1 at 445.09 would confirm the drop was merely a shakeout. It would not signal the start of a deeper correction. The still-rising 200-day EMA at 334.47 underscores how much room the long-term trend has before it would even be threatened.
The Bearish Risk Scenario
The bearish risk for MongoDB, Inc. stock centers on the “sell the news” reaction to strong earnings, which often signals stretched positioning and can take time to resolve.
In contrast, the reaction to genuinely strong earnings is itself a warning sign. MongoDB delivered everything shareholders expected. The stock fell anyway. That kind of response often reflects stretched positioning heading into the print. It can take time to work off. Notably, broader macro pressure is also in play. Oil prices have climbed for a third straight day amid renewed U.S.-Iran tensions. Additionally, 5% yields alongside fresh Fed data are weighing on risk sentiment more generally.
On the technical front, a break below daily support at 426.93 would mark the first real crack in the trend. If that support fails while the daily MACD histogram remains negative, the next reference point becomes the 20-day EMA near 417.17. A sustained move below that level, combined with continued hourly weakness under 433.64, would invalidate the bullish thesis. It would point toward a deeper consolidation rather than a quick recovery.
Closing Thoughts on MDB Stock Positioning
MongoDB, Inc. stock sits at a critical crossroads, with an intact daily trend offset by fading momentum and a neutral hourly regime that demands patience.
Overall, the daily trend structure remains intact and technically bullish. Yet the size of Tuesday’s post-earnings drop, combined with fading daily momentum and a neutral hourly regime, means the path forward is not straightforward. Elevated volatility, reflected in the daily ATR of 22.49, suggests wide price swings will continue near term. Strong fundamentals and raised guidance contrast with a market reaction that ran counter to the numbers. Positioning around current levels calls for patience. Close attention to how price behaves around the 426.93 support and the 437–439 resistance cluster will be essential in the sessions ahead.
FAQ
What are the key support and resistance levels for MDB stock?
The critical near-term support sits at 426.93, with the 20-day EMA at 417.17 serving as the next reference below. On the upside, resistance clusters in the 437–439 zone, with R1 at 445.09 representing the next upside target.
Is MongoDB stock still in a bullish trend after earnings?
Yes, the daily trend remains classified as bullish. Price continues to trade above the 20-day, 50-day, and 200-day EMAs. However, fading MACD momentum and a neutral hourly regime suggest the trend is consolidating rather than accelerating.
What did MongoDB report for Q2 fiscal 2027?
MongoDB reported Q2 revenue of $772 million, up 30% year-over-year. The company raised full-year guidance to between $2.99 billion and $3.03 billion, and lifted its Atlas growth outlook to roughly 27%.
Disclaimer: This article is for informational purposes only and does not constitute financial advice, an investment recommendation, or a solicitation to buy or sell any financial instrument or cryptocurrency. The analysis provided is not indicative of future results. Investing in crypto assets and financial markets carries a high risk of capital loss. Always do your own research (DYOR) and consult a qualified financial advisor before making any decision.
Article produced with the assistance of artificial intelligence and reviewed by the editorial team.
