




Dell Technologies Inc. stock faces a sharp contrast: a blowout Q2 with record AI server orders and a raised 2027 outlook collides with a violent technical pullback. Price broke short-term structure while momentum turned bearish, leaving the stock at a genuine inflection point.
Summary
Key takeaways
- Dell Technologies Inc. stock suffered a violent single-session reversal, closing at 425.00 after hitting a high of 462.83.
- The 50-day EMA at 424.35 is the immediate technical line in the sand for the near-term trend.
- Daily RSI14 at 44.89 and a fresh bearish MACD crossover confirm momentum has shifted to the sellers.
- Despite technical damage, record AI server demand and a raised 2027 outlook provide a competing bullish narrative.
- ATR14 at 24.19 signals elevated volatility, meaning swings in either direction are likely to be fast.
Daily Chart: A Steep Pullback Inside a Long-Term Uptrend
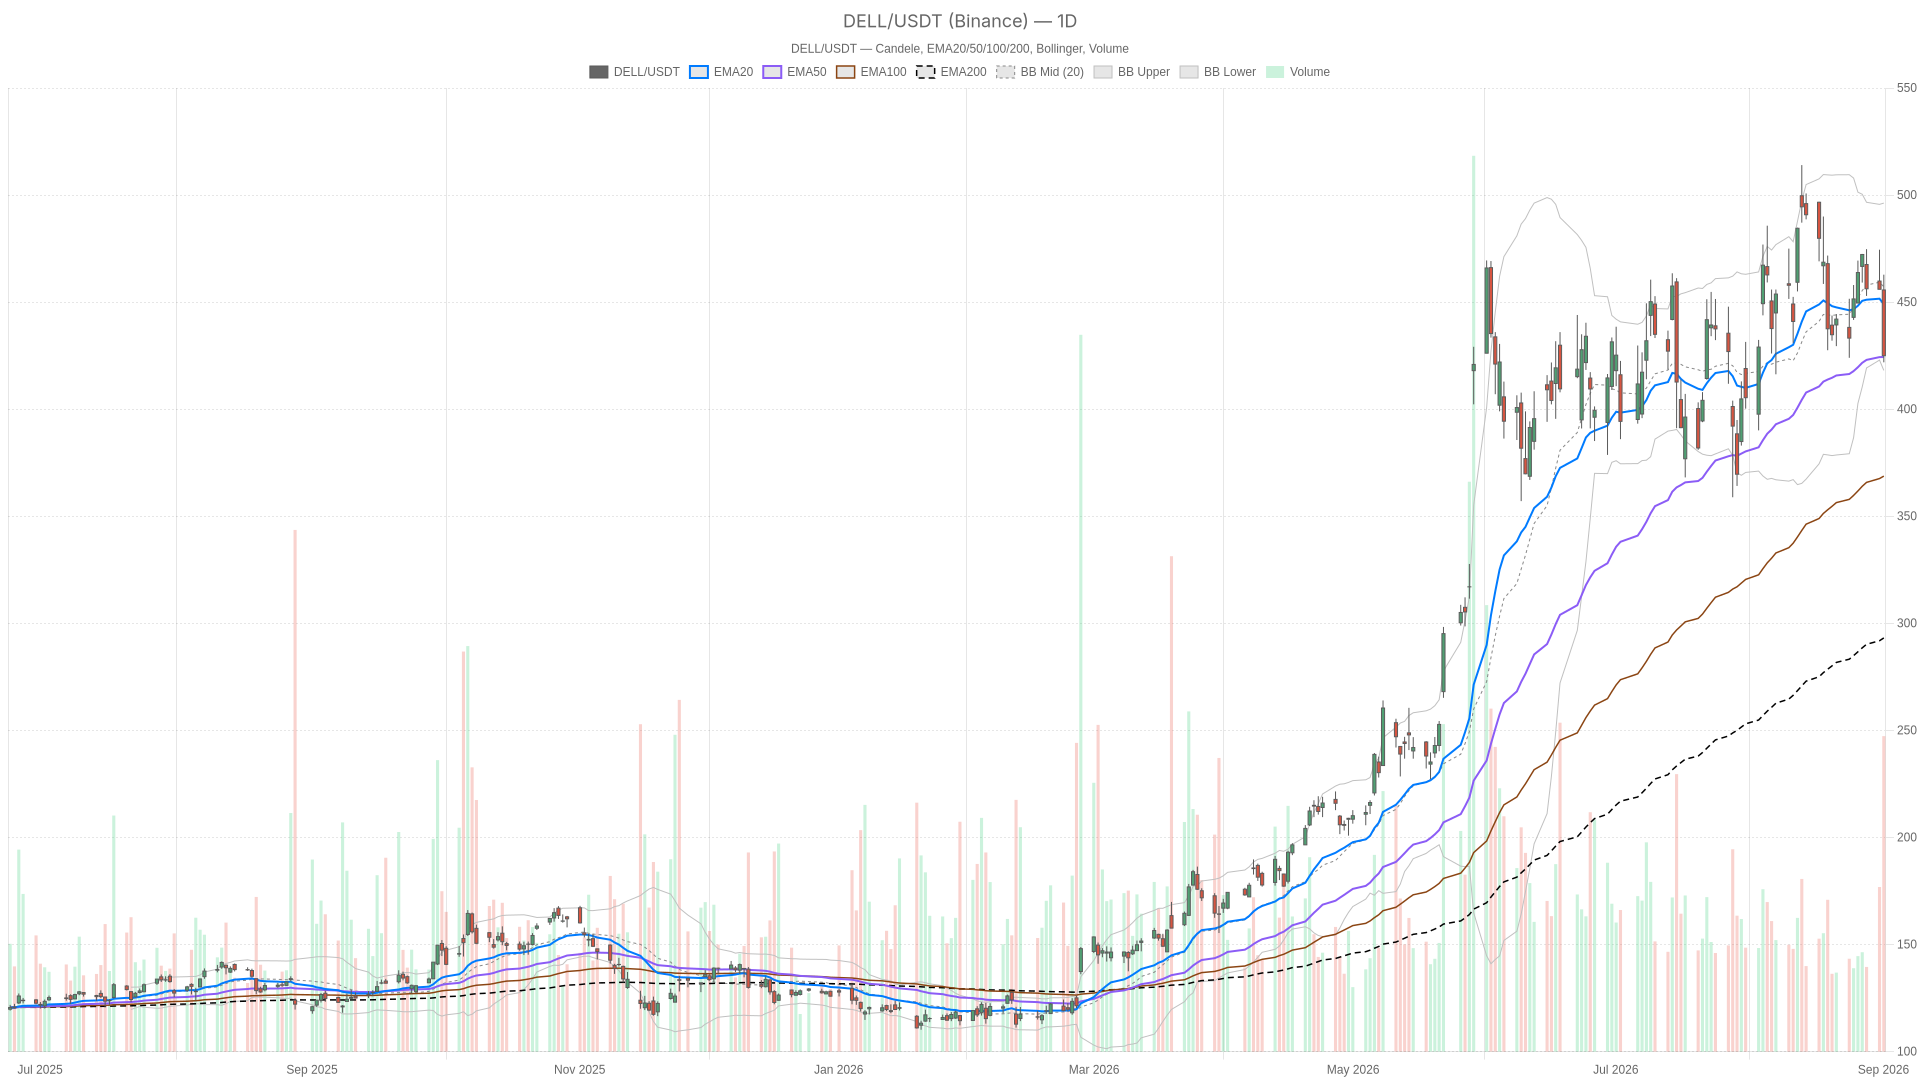
The daily chart shows a steep pullback that has broken short-term structure. However, the long-term uptrend remains intact with the 200-day EMA at 293.19 sitting far below current price.
Price Action and EMA Test
Price opened at 455.69, spiked to a high of 462.83, then collapsed to a low of 421.89 before closing at 425.00. That is a wide range for a single session. It points to heavy two-way volatility around the earnings event rather than a clean directional move.
The 200-day EMA at 293.19 sits far below the current price near 425. This confirms the broader uptrend remains structurally intact. However, the shorter-term picture has clearly deteriorated. Price now trades below the 20-day EMA at 449.07 and sits almost exactly on the 50-day EMA at 424.35. That EMA cluster is the first real test of whether this is a routine pullback or the start of something deeper.
Momentum Turns Bearish
Momentum backs up the cautious read. RSI14 on the daily is at 44.89, just under the neutral 50 line. This shows sellers have regained a slight edge. The MACD line at 5.00 has crossed below its signal line at 8.95, producing a negative histogram of -3.95. That is a fresh bearish MACD crossover. It typically signals momentum is rolling over rather than accelerating.
Volatility and Pivot Framework
Volatility is elevated. The daily ATR14 stands at 24.19, a large figure confirming this is not a quiet market. Bollinger Bands show the mid-line at 457.18, with the upper band at 496.26 and the lower band at 418.11. Price closed just above that lower band. This puts Dell Technologies Inc. stock near the edge of its recent volatility envelope, rather than in the middle of a calm range.
Pivot levels frame the immediate battle zone. The daily pivot point sits at 436.57, with resistance at 451.26 and support at 410.32. Overall, the daily regime reading is neutral. This fits a market digesting a violent earnings-week swing rather than trending cleanly in either direction.
Hourly Chart: Momentum Confirms Near-Term Weakness
The 1-hour chart reinforces the bearish near-term picture. Price sits below all major EMAs while RSI is deeply oversold at 24.64, confirming sellers remain in control.
Price closed at 424.36, sitting below the 20-hour EMA at 446.10 and the 50-hour EMA at 451.87. It also sits below the 200-hour EMA at 445.75. This forms a fully bearish EMA stack on this timeframe.
Meanwhile, RSI14 on the hourly has dropped to 24.64, a deeply oversold reading. The MACD line at -8.44 is well below its signal at -4.30. The histogram of -4.14 shows downside momentum is still building rather than fading. Bollinger Bands show price at 424.36, close to the lower band of 421.12. This is consistent with an oversold but not yet stabilizing tape.
In short, the hourly timeframe confirms the daily weakness. Both point toward a market that sold off hard into the close ahead of the earnings release. This happened even though the fundamental news that followed was strongly positive.
15-Minute Chart: Execution Context Near the Lows
The 15-minute chart confirms bearish micro-level conditions. However, early MACD histogram stabilization hints at possible consolidation right at the lows.
On the 15-minute chart, the regime reading is explicitly labeled bearish. Price is trading below its 20-period EMA at 432.74 and its 50-period EMA at 443.09. It also trades below the 200-period EMA at 453.18, forming a clean descending stack. RSI14 at 28.83 confirms oversold conditions at this micro level as well.
There is, however, a small notable detail. The MACD histogram on the 15-minute has ticked up to 0.14, barely positive. But the MACD line at -6.23 remains below its signal at -6.37. That is not a reversal signal on its own, yet it hints at some early stabilization right at the lows. Price is hugging the 15-minute pivot point at 424.86. It sits between resistance at 427.83 and support at 421.39. This frames the immediate short-term battleground for execution.
Bullish Scenario for Dell Technologies Inc. Stock
The bullish case for Dell Technologies Inc. stock rests on fundamentals, not chart structure. Record AI server demand and a raised 2027 outlook can shift sentiment quickly.
If buyers step back in and price reclaims the daily 20-EMA near 449.07, that would start to repair the technical damage. A subsequent push through the daily pivot resistance at 451.26 would strengthen the recovery. A move back toward the daily Bollinger mid-line at 457.18 would be the next logical objective. A daily RSI recovery above 50 would confirm momentum has genuinely turned. The long-term uptrend gives this scenario a structural tailwind that the short-term pullback has not erased.
Bearish Scenario and What Would Invalidate the Bullish Case
The bearish scenario is built directly on what the charts are showing. Price is testing critical support at the 50-day EMA, and momentum indicators are aligned to the downside.
If price fails to hold the 50-day EMA at 424.35 and breaks below the daily support at 410.32, that would confirm the pullback is deepening rather than stabilizing. A close beneath the daily Bollinger lower band of 418.11 would add further weight to that case.
On the hourly chart, a decisive break below the Bollinger lower band at 421.12 would be significant. A break below the pivot support at 421.39 would add to the bearish case. Both would occur despite already oversold RSI. This would suggest sellers remain in control. It would also indicate the earnings catalyst has not yet been absorbed by the tape. That combination would invalidate the near-term bullish thesis, even with the long-term uptrend still technically intact.
Closing Take
Dell Technologies Inc. stock is trading at a genuine inflection point. Technical weakness and fundamental strength are in direct conflict, and neither side has yet won.
The daily and hourly timeframes are aligned in showing a sharp, high-volatility pullback with bearish momentum signals. Meanwhile, the fresh news backdrop offers a competing bullish narrative. A strong earnings beat and record AI server demand tell a different story, one the price action has not yet confirmed.
Given the elevated ATR readings across timeframes, swings in either direction are likely to be fast. Positioning here should account for that uncertainty. The key EMA and pivot levels outlined above serve as the practical lines in the sand for whichever direction ultimately wins out.
FAQ
What is the current price of Dell Technologies Inc. stock?
Dell Technologies Inc. stock closed at 425.00 after a volatile session that saw a high of 462.83 and a low of 421.89. The wide range reflects heavy two-way volatility around the earnings event.
What are the key support levels for Dell Technologies Inc. stock?
The immediate support is the 50-day EMA at 424.35, which price is currently testing. Below that, the daily Bollinger lower band at 418.11 and the daily pivot support at 410.32 represent the next key downside levels.
Is the long-term uptrend still intact?
Yes. The 200-day EMA sits at 293.19, far below the current price near 425. This confirms the broader uptrend remains structurally intact despite the sharp short-term pullback.
What does the bearish MACD crossover signal?
The MACD line at 5.00 has crossed below its signal line at 8.95, producing a negative histogram of -3.95. This fresh bearish MACD crossover typically signals momentum is rolling over rather than accelerating, giving sellers a near-term edge.
Disclaimer: This article is for informational purposes only and does not constitute financial advice, an investment recommendation, or a solicitation to buy or sell any financial instrument or cryptocurrency. The analysis provided is not indicative of future results. Investing in crypto assets and financial markets carries a high risk of capital loss. Always do your own research (DYOR) and consult a qualified financial advisor before making any decision.
Article produced with the assistance of artificial intelligence and reviewed by the editorial team.
