



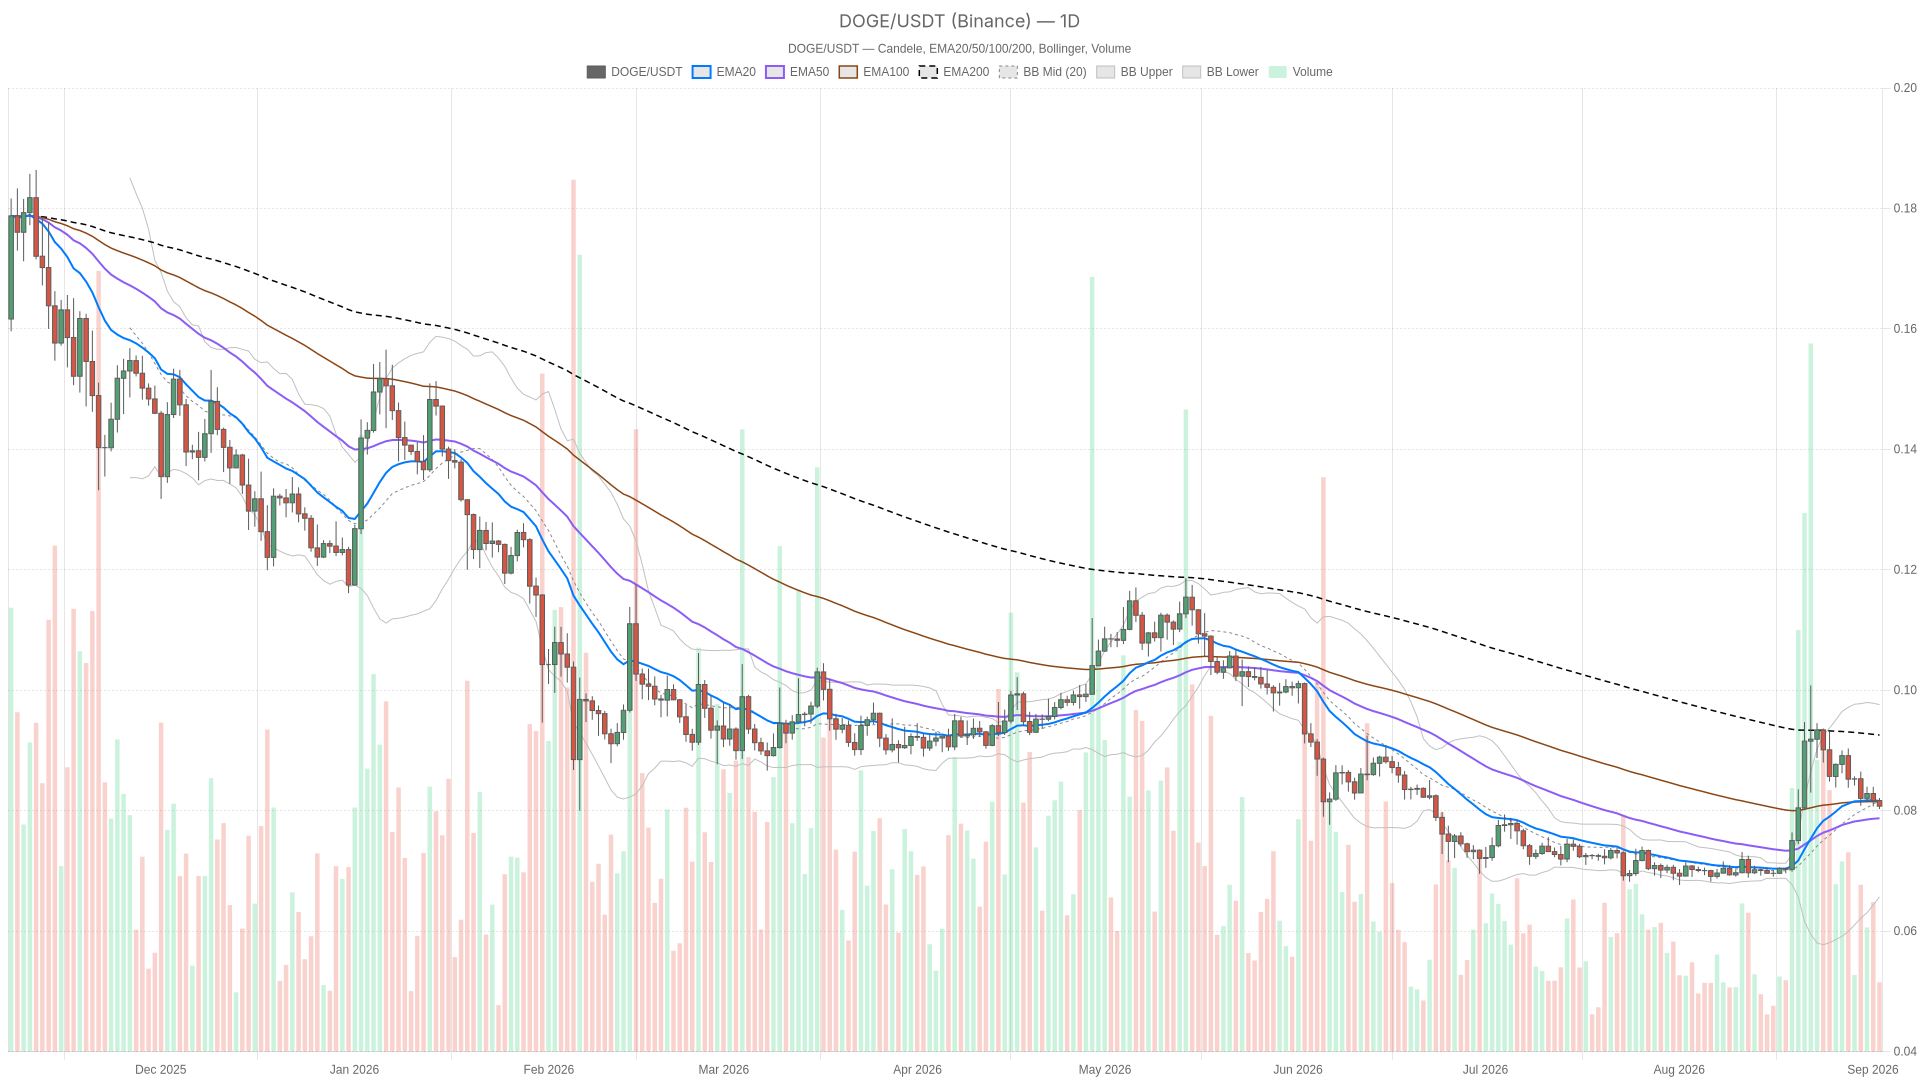
DOGE is trading near $0.08 on September 2, 2026, wedged between its 20-day and 50-day EMAs while intraday charts flash bearish. The daily view on Dogecoin price today looks neutral, but shorter timeframes tell a different story — one where sellers are gaining ground beneath a calm surface.
Summary
Key takeaways
- DOGE trades around $0.08, stuck between the 20-day and 50-day EMAs on the daily chart with the 200-day EMA at $0.09 acting as overhead resistance
- Daily RSI14 at 50.75 and all MACD components at zero confirm a textbook neutral regime with no directional momentum
- Intraday charts (H1 and M15) are already in bearish territory with RSI readings near 35, signaling short-term selling pressure
- Total crypto market capitalization fell 3.27% in 24 hours to roughly $2.6 trillion, while Bitcoin dominance rose to 59.08% — a classic altcoin-rotation signal
- Fear & Greed Index sits at 63 in Greed territory, contradicting the weakening price action across the tape
Daily Chart: Neutral Regime, No Momentum Either Way
The daily chart shows no directional bias at all, with RSI14 parked at 50.75 and all MACD components — line, signal, and histogram — reading precisely zero. That is about as flat a momentum profile as a trader will encounter. The system’s own regime tag on D1 confirms it: neutral, with no edge in either direction.
Bollinger Bands reinforce the stalemate. Price is pinned at the midline near $0.08, with the upper band at $0.10 and the lower band at $0.07. Sitting at the midpoint of a wide volatility envelope means DOGE has not committed to either side. The daily ATR14 of $0.01, roughly 12–13% of current price, confirms that genuine movement is still happening session to session even if net direction over the period has gone nowhere. Daily pivot levels — pivot point, R1, and S1 — are all clustered tightly around $0.08, which underscores the absence of any obvious nearby support or resistance standing out on the higher timeframe.
Intraday Weakness: H1 and M15 Are Already Bearish
Both the 1-hour and 15-minute charts are already in bearish territory, with RSI readings of 35.61 and 35.81 respectively. Those levels are edging toward oversold but have not arrived there yet, leaving room for further downside. Price on both timeframes sits below the EMA20/50/200 cluster, a classic structural sign that short-term selling pressure is building beneath a daily chart that otherwise looks calm.
This is the disagreement worth flagging directly. The daily structure says wait and see, but the 1H and 15m charts indicate sellers currently hold the upper hand. That tension is precisely why the current picture should not be read off a single timeframe. If one watches only the daily, DOGE appears to be coiling for a move. If one watches the hourly, it appears to already be rolling over. Both interpretations are valid simultaneously — they simply operate at different speeds. However, the broader market context tilts the weight of the evidence toward the shorter timeframes for now.
Bullish Scenario
The bullish case requires a reclaim of the $0.08 EMA cluster on the 1-hour chart and RSI pushing back above the 40–50 zone. That sequence would go a long way toward invalidating the current bearish intraday regime. Moreover, a daily close that pushes through the Bollinger midline toward the $0.10 upper band — ideally with the MACD histogram actually turning positive instead of sitting flat at zero — would be the first real evidence that buyers are stepping back in rather than merely defending a range. Without those confirmations, any bounce remains a short-covering event rather than a genuine trend shift.
Bearish Scenario
The bearish argument leans on the broader market context as much as the DOGE chart itself. With total market capitalization down over 3% in a single day and Bitcoin dominance climbing past 59%, capital rotation out of altcoins is a tangible risk. DOGE tends to get hit harder than BTC during these phases, and the current setup offers little reason to expect a different outcome this time.
If the 1H and 15m weakness bleeds into the daily — meaning RSI14 on D1 breaks below 50 and price loses the $0.08 EMA20/50 support — the next reference point becomes the lower Bollinger Band near $0.07. A daily close below that zone would confirm the neutral regime has broken to the downside. That said, it would also mean the elevated Greed reading of 63 was masking underlying distribution rather than reflecting genuine strength, a divergence that typically resolves in favor of price action over sentiment.
Positioning and Risk
Right now, Dogecoin price today is a case study in mixed signals: a flat, momentum-less daily chart sitting inside a wide volatility band, short-term charts already leaning bearish, and a macro backdrop where the broader market is contracting even as sentiment stays in Greed territory. None of these individually point to a clean, high-conviction trade. The ATR readings confirm volatility has not disappeared even if net direction has stalled — meaning whichever way this resolves, the move is unlikely to be slow.
Traders sizing positions here should weigh the fact that daily and intraday timeframes are actively disagreeing. That is not a setup that rewards conviction in either direction until one timeframe forces the other to fall in line. Patience around the $0.07–$0.10 range, rather than forcing a directional bet, is probably the more honest read of where things stand.
FAQ
What is the Dogecoin price today?
As of September 2, 2026, DOGE is trading around $0.08, wedged between the 20-day and 50-day EMAs. The 200-day EMA sits just above at $0.09, acting as overhead resistance on the daily chart.
Is Dogecoin bullish or bearish right now?
The daily chart is neutral — RSI14 at 50.75 and MACD at zero show no momentum in either direction. However, intraday timeframes (H1 and M15) are already in bearish territory with RSI near 35 and price below the EMA cluster, signaling short-term selling pressure is building.
What are the key support and resistance levels for DOGE?
Key support sits at the lower Bollinger Band near $0.07, with the daily EMA20/50 cluster at $0.08 serving as a nearer-term floor. Resistance is at the upper Bollinger Band around $0.10, with the 200-day EMA at $0.09 acting as an intermediate ceiling.
Why is Dogecoin struggling despite neutral daily readings?
The broader crypto market is contracting — total market cap fell 3.27% in 24 hours while Bitcoin dominance rose to 59.08%. That pattern typically signals capital rotating out of altcoins like DOGE and into BTC as a relative safe haven, creating headwinds even when DOGE’s own daily chart shows no clear breakdown yet.
Disclaimer: This article is for informational purposes only and does not constitute financial advice, an investment recommendation, or a solicitation to buy or sell any financial instrument or cryptocurrency. The analysis provided is not indicative of future results. Investing in crypto assets and financial markets carries a high risk of capital loss. Always do your own research (DYOR) and consult a qualified financial advisor before making any decision.
Article produced with the assistance of artificial intelligence and reviewed by the editorial team.
