



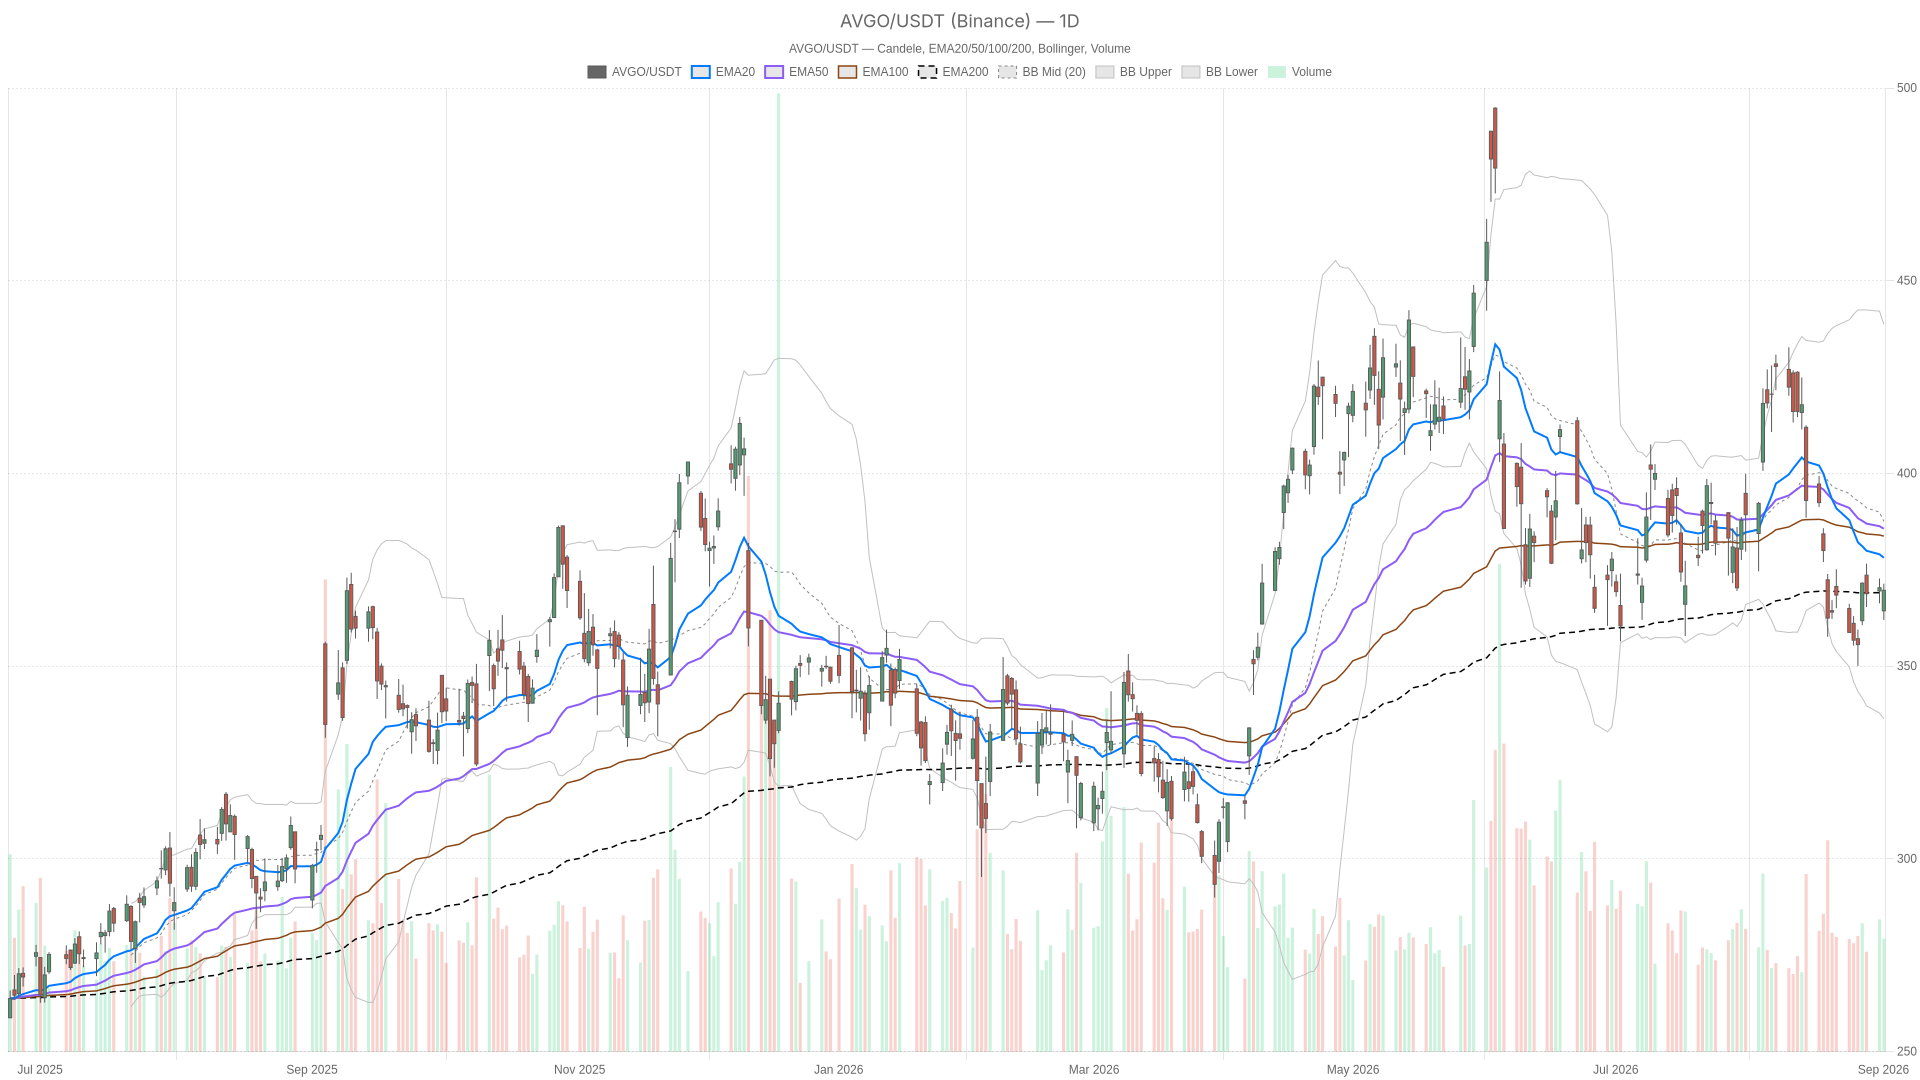
AVGO stock closed Tuesday at 369.68, barely above its daily 200-day EMA of 369.07, just hours before fiscal Q3 earnings on Wednesday, September 2. This proximity is no coincidence — it frames the entire technical picture heading into the print.
Summary
Key takeaways
- AVGO stock closed at 369.68, fractionally above the 200-day EMA of 369.07
- Daily RSI14 at 43.33 confirms waning buying pressure without reaching oversold territory
- MACD histogram is widening to -1.67, signaling bearish momentum is gaining traction
- ATR14 at 12.48 suggests any post-earnings move could be unusually large
- A close below S1 at 363.99 would flip the technical picture decidedly bearish
Daily Structure: AVGO Stock Loses Momentum, But the 200-EMA Floor Holds
AVGO stock’s intermediate trend has softened, but the long-term uptrend remains structurally intact as long as the 200-day EMA at 369.07 holds as support.
Trend and Momentum Are Diverging
On the daily chart, price trades below both the 20-day EMA (378.14) and the 50-day EMA (385.67). The intermediate trend has clearly turned soft. However, the close still sits marginally above the 200-day EMA. The broader uptrend structure has not technically broken. The market has lost short-term momentum without yet surrendering its longer-term footing.
The daily RSI14 at 43.33 reinforces that reading. It sits below the neutral 50 line, confirming waning buying pressure. Yet it remains nowhere near oversold territory. Meanwhile, the daily MACD paints a clearer bearish tilt. The line sits at -8.08, below its -6.41 signal, with a widening histogram of -1.67. That widening gap suggests down-momentum is still gaining traction on the daily timeframe.
Elevated Volatility Sets the Stage for a Sharp Reaction
At the same time, volatility warrants attention heading into the print. The daily ATR14 stands at 12.48, a wide range by AVGO’s standards. It signals that whatever the earnings reaction turns out to be, it could be sizable. Bollinger Bands add useful context. Price trades well below the mid-band (387.54) and far from the upper band (438.70). This leaves ample room for either a recovery push or further slippage toward the lower band near 336.38.
Daily pivot levels frame the immediate battle lines. Resistance sits at R1 (373.39), with the pivot point at 367.69 and support at S1 (363.99). Overall, the daily regime reads as neutral. It is not a trend that has broken down, but not one confidently pushing higher either.
1H View: Stabilization, Not Confirmation
The hourly chart for AVGO stock shows consolidation rather than directional conviction, with price hovering between clustered short-term moving averages.
Zooming into the hourly chart complicates the daily narrative somewhat. The 1H close of 369.65 sits almost exactly between its 20-EMA (368.37) and 50-EMA (368.35). This tight cluster typically signals consolidation rather than conviction. RSI14 on the hourly is at 53.83, mildly above neutral. It hints at a short-term buyer presence that the daily chart does not fully reflect.
At the same time, the hourly 200-EMA sits far higher at 380.33. The broader hourly trend remains tilted downward even as price stabilizes near-term. The hourly MACD is similarly split. The line (1.09) is still below the signal (1.29), with a negative histogram of -0.19. This suggests the recent bullish push on this timeframe is already losing steam. In short, the 1H timeframe is neither confirming nor firmly rejecting the daily softness. It is simply pausing.
15m Execution Context: Short-Term Bulls Are in Control
On the 15-minute chart, AVGO stock displays the most constructive structure across all timeframes, with EMAs stacked bullishly ahead of the earnings print.
EMAs are stacked bullishly. The 20-EMA at 369.06 sits above the 50-EMA at 368.61, which sits above the 200-EMA at 368.02. The regime reads outright bullish. RSI14 at 53.82 and a positive MACD histogram (0.10) both support a short-term upward bias. Pivot resistance sits at 370.17 (R1), with support at 368.97 (S1). Still, this is useful purely for timing entries or exits around the earnings event. It does not override the daily bias, but it does confirm sellers have not taken full control heading into the print.
The Bullish Scenario for AVGO Stock
AVGO stock’s bullish case depends on holding the 200-EMA and reclaiming the 20-EMA at 378.14, ideally clearing R1 resistance at 373.39 on strong volume.
The bullish case rests on two pillars. First, technically, holding above the daily 200-EMA (369.07) and reclaiming the daily 20-EMA (378.14) would go a long way toward repairing the momentum picture. Clearing R1 resistance at 373.39 on strong volume would reinforce that shift. Second, fundamentally, the setup lines up with the news flow. Morgan Stanley has issued a notably bullish pre-earnings call. The firm points to substantial AI-driven growth ahead for the chip giant.
Broadcom has also just launched VMware Private AI Cloud, VMware AI Factory, and the AgentMinder governance stack. These are new tools aimed squarely at enterprise AI adoption. Notably, coverage from The Motley Fool highlights that Broadcom’s profit has been growing roughly four times faster than its revenue. The next test arrives at the $29.4 billion mark, a detail that speaks directly to operating leverage. If Wednesday’s numbers confirm that trend, a break back above the EMA cluster becomes far more credible.
The Bearish Scenario for AVGO Stock
A daily close below the 200-EMA at 369.07 and through S1 at 363.99 would flip AVGO stock’s technical picture decidedly bearish.
On the other hand, the bearish case is equally straightforward. A daily close below the 200-EMA (369.07) and through S1 (363.99) would decisively flip the technical narrative. This risk is amplified by the MACD histogram already widening to the downside. Zacks’ earnings preview flags exactly this kind of concern. AVGO earnings are expected to benefit from AI chip demand and software growth. However, margin pressure and a stretched valuation raise caution.
If the report leans into those concerns rather than the AI upside narrative, the downside could accelerate. The daily RSI14 reading of 43.33 has ample room to drift lower before hitting oversold territory. Meanwhile, the elevated ATR14 of 12.48 means that move could happen quickly.
Closing Take on AVGO Stock
AVGO stock is caught in a classic pre-earnings standoff, with fading daily momentum balanced against intact long-term support ahead of Wednesday’s report.
Overall, AVGO stock is caught in a classic pre-earnings standoff. The daily chart shows fading momentum but intact long-term support at the 200-EMA. The 1H timeframe is stabilizing without confirming a clear direction. The 15m chart shows short-term buyers still nominally in charge. Therefore, positioning ahead of Wednesday’s report demands caution. With daily ATR near 12.48, volatility around the print is likely to dominate. Both AI-demand tailwinds and valuation risk are in play. A clean directional resolution appears unlikely.
FAQ
What is the key support level for AVGO stock ahead of earnings?
The critical support is the daily 200-day EMA at 369.07, which AVGO stock closed just above on Tuesday. A breakdown below this level and through S1 at 363.99 would flip the technical picture bearish.
What would make AVGO stock’s bullish case credible after earnings?
For the bullish scenario to gain credibility, AVGO stock must hold above the 200-day EMA (369.07) and reclaim the 20-day EMA at 378.14, ideally clearing R1 resistance at 373.39 on strong post-earnings volume.
What do momentum indicators say about AVGO stock right now?
The daily RSI14 at 43.33 sits below the neutral 50 line, confirming waning buying pressure. The MACD histogram is widening to -1.67, signaling that bearish momentum is gaining traction, though not yet violently.
Disclaimer: This article is for informational purposes only and does not constitute financial advice, an investment recommendation, or a solicitation to buy or sell any financial instrument or cryptocurrency. The analysis provided is not indicative of future results. Investing in crypto assets and financial markets carries a high risk of capital loss. Always do your own research (DYOR) and consult a qualified financial advisor before making any decision.
Article produced with the assistance of artificial intelligence and reviewed by the editorial team.
