



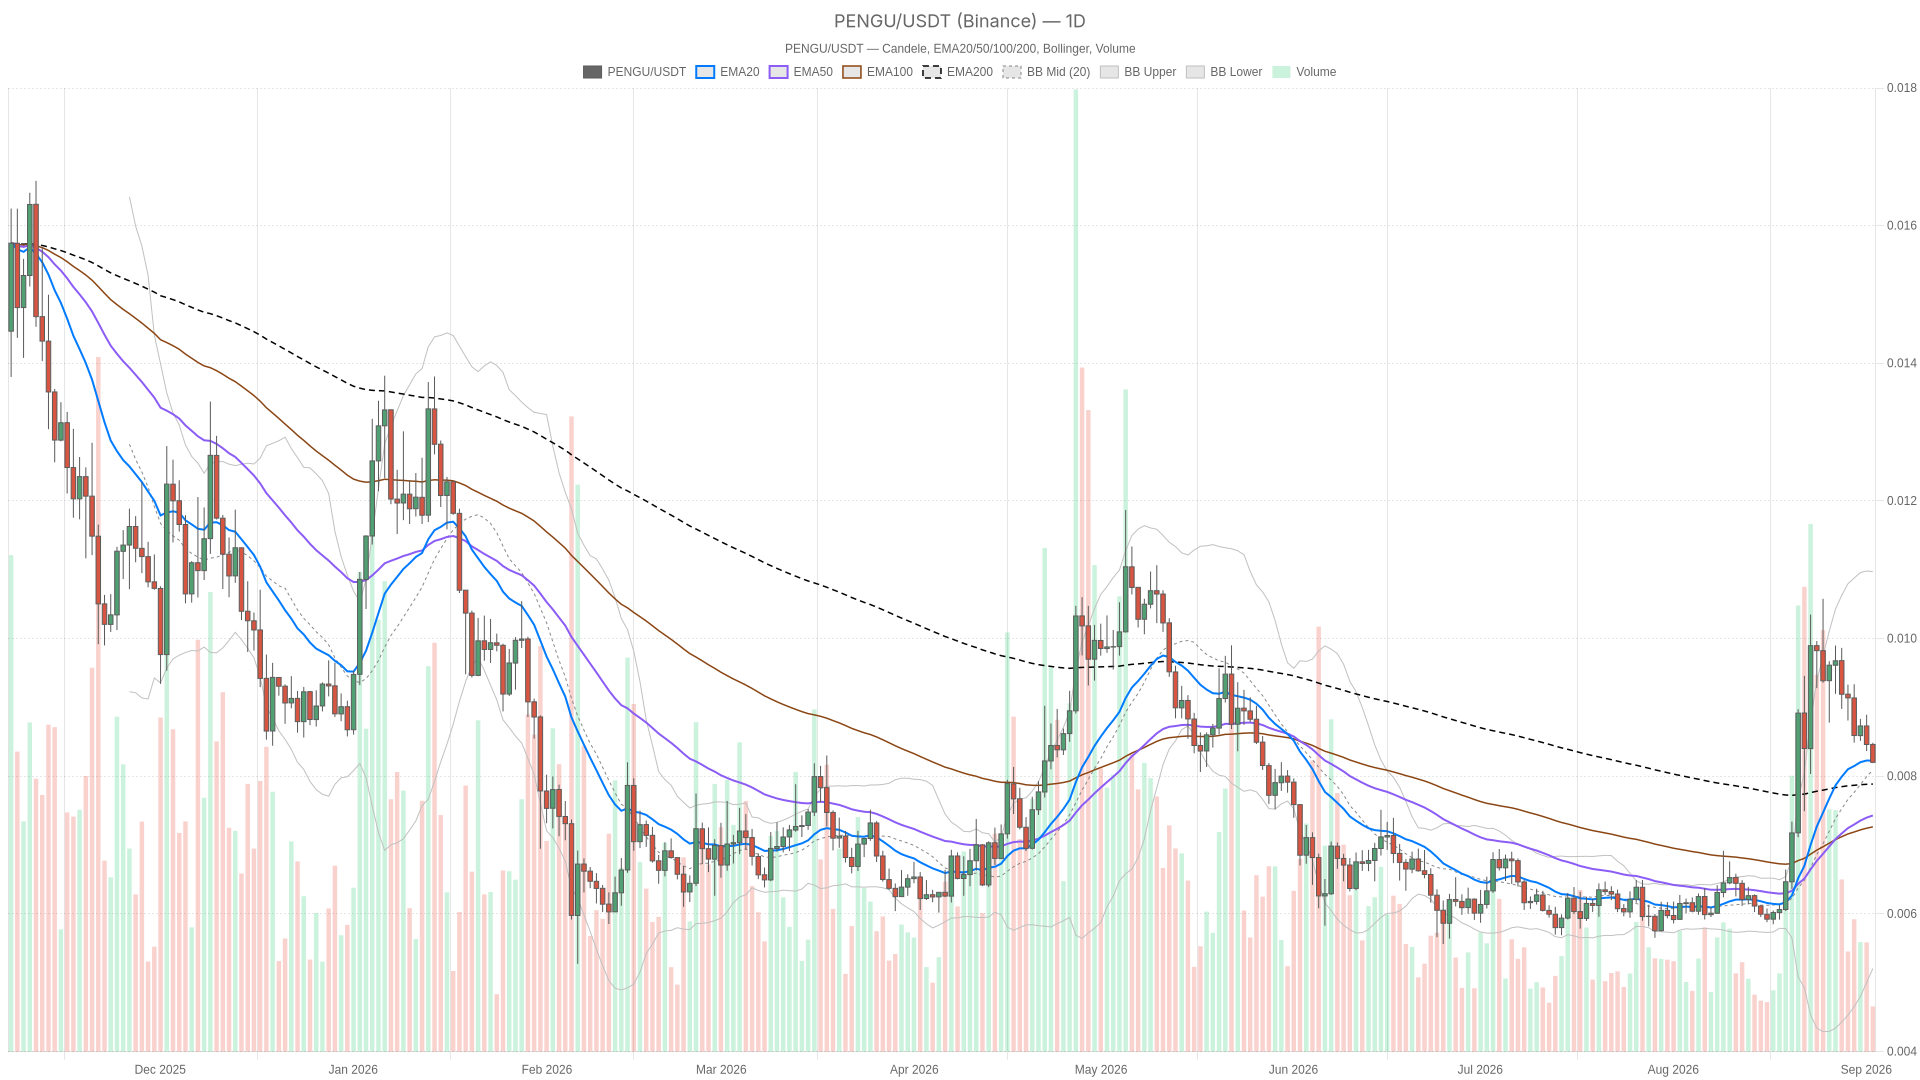
As of September 2, 2026, the daily chart for Pudgy Penguins crypto reflects a market stuck firmly in neutral. The RSI sits at 53.02, while total crypto market capitalization slipped 3.53% to roughly $2.59 trillion. Bitcoin dominance held at 59.09% during the pullback, signaling capital rotation rather than outright retreat.
Summary
Key takeaways
- PENGU’s daily RSI sits at 53.02, a perfectly neutral reading with no directional bias on the daily chart.
- The 1-hour and 15-minute charts show bearish regimes, with RSI values of 30.97 and 31.52 respectively.
- Bollinger Bands are compressed across all timeframes, signaling an imminent volatility expansion once the squeeze resolves.
- Total crypto market capitalization fell 3.53% in 24 hours, while Bitcoin dominance held at 59.09%.
- The Fear & Greed Index reads 63 (Greed), creating a notable gap between sentiment and actual price action.
Trend Structure vs. Short-Term Momentum
The daily chart for PENGU currently shows no trending bias. It is neutral, with price awaiting a catalyst to define the next directional move. However, the 1-hour and 15-minute timeframes have already shifted into bearish territory, with RSI readings of 30.97 and 31.52 indicating that intraday sellers hold control for now.
This multi-timeframe divergence demands respect for both signals rather than favoring one. The daily chart defines the macro bias, and it is simply undecided — not bearish. Meanwhile, the lower-timeframe weakness shows where near-term pressure originates. Until that pressure drags the daily RSI below the neutral 50 zone, this reads more like a pullback within consolidation than the start of a confirmed downtrend.
Momentum and Volatility: A Market Holding Its Breath
Momentum indicators across all three timeframes are essentially flat, with MACD line, signal, and histogram sitting at zero. That is not a bullish or bearish signal on its own. Rather, it confirms that no directional conviction is being built right now. Combined with the EMA20, EMA50, and EMA200 all converging tightly on every timeframe, the chart shows almost no slope at all — price is glued to its averages.
The Bollinger Bands reinforce this picture. Upper, middle, and lower bands have compressed close together, which is the textbook definition of a volatility squeeze. Moreover, ATR14 sits near zero and pivot levels remain similarly tight, reinforcing just how narrow the current trading band has become for PENGU right now. Squeezes like this do not stay compressed forever; they tend to resolve into sharper directional moves once volatility returns.
Reading the Broader Market Backdrop
The wider crypto market is not providing much of a tailwind at the moment. The 24-hour market cap contraction of 3.53% shows risk appetite cooling broadly, even as Bitcoin’s dominance metrics suggest it is holding up better than the altcoin complex. However, on-chain trading activity tells a slightly different story — liquidity has not dried up despite the headline drop.
DefiLlama data shows daily fee growth accelerating across several major DEXs. Uniswap V3 fees rose 22.85% on the day, Ekubo jumped 49.14%, and Fluid DEX posted a 28.67% one-day increase. That pattern suggests active reshuffling rather than a genuine retreat, even as the aggregate market capitalization dipped.
Bullish and Bearish Scenarios
The bullish case hinges on the 1-hour and 15-minute RSI readings recovering back above the 50 line. Ideally, the daily regime would shift from neutral to something more constructive, with the EMA cluster starting to separate and slope upward as the volatility squeeze resolves higher. Renewed DEX activity and a stabilizing broader market would support this expansion move.
This view gets invalidated quickly if the daily RSI rolls over below 50 and the lower timeframes keep printing fresh lows without any bounce. The bearish case, by contrast, treats the current short-term weakness as early confirmation of a larger shift. That scenario gains credibility if Bitcoin dominance keeps climbing while total market cap continues falling — a combination that typically punishes altcoins hardest. It gets invalidated if sellers lose their grip on the near-term tape and the daily regime stays neutral-to-bullish.
Positioning and Risk Context
Right now, Pudgy Penguins crypto is in a genuinely undecided spot — not trending, not collapsing, just compressed and waiting for a trigger. The mismatch between a Greed reading of 63 and a market that just lost 3.53% of its total capitalization in a day is a reminder that sentiment indicators can lag price by a step. That lag is exactly where surprises tend to happen.
With ATR near zero and the Bollinger Bands squeezed this tight, whichever direction this eventually breaks is likely to move faster than the recent quiet price action suggests. Consequently, anyone tracking this setup should treat the current calm as temporary rather than settled. Low-volatility periods in crypto rarely last long before the range gets resolved one way or the other.
FAQ
What is the current RSI for Pudgy Penguins crypto?
The daily RSI for PENGU sits at 53.02 as of September 2, 2026, reflecting a neutral stance. On shorter timeframes, the 1-hour RSI is at 30.97 and the 15-minute RSI is at 31.52, both in bearish territory.
Why are the Bollinger Bands important for PENGU right now?
The Bollinger Bands have compressed tightly across all timeframes, signaling a volatility squeeze. This pattern historically resolves into a sharp directional move once the squeeze releases, making the current calm an important setup to monitor.
Is the broader crypto market supporting PENGU?
The broader market is not providing strong tailwinds, with total crypto market capitalization down 3.53% in 24 hours. DEX trading activity remains robust, however — Uniswap V3 fees rose 22.85% and Ekubo jumped 49.14% — suggesting liquidity is reshuffling rather than retreating.
Disclaimer: This article is for informational purposes only and does not constitute financial advice, an investment recommendation, or a solicitation to buy or sell any financial instrument or cryptocurrency. The analysis provided is not indicative of future results. Investing in crypto assets and financial markets carries a high risk of capital loss. Always do your own research (DYOR) and consult a qualified financial advisor before making any decision.
Article produced with the assistance of artificial intelligence and reviewed by the editorial team.
