



Amid a broader market pullback, one token stands out for its resilience. Uniswap crypto is trading at $5.99 as of September 2, 2026, holding near its highs despite a 3.39% drop in total crypto market capitalization and Bitcoin dominance climbing near 59%.
Summary
Key takeaways
- UNI trades at $5.99 with a daily RSI of 79.38, deep in overbought territory
- Uniswap V3 fees surged 127.25% over 30 days, though 7-day figures show cooling
- The daily EMA stack remains firmly bullish: EMA20 above EMA50 above EMA200
- 1-hour MACD histogram has turned negative, signaling fading upside momentum
- A daily close below $5.72 would confirm the bearish mean-reversion scenario
The Fear & Greed Index stands at 63, signaling Greed even as the total market cap contracts. For UNI, the protocol data offers a more compelling signal. Uniswap V3 posted a 127.25% fee increase over the past 30 days, while V4 recorded 99.99%. Both metrics dropped over the last 7 days — by 12.6% and 26.77% respectively — suggesting the initial trading surge is cooling, though medium-term usage remains a genuine fundamental tailwind.
Daily Chart: Strong Trend, Stretched Conditions
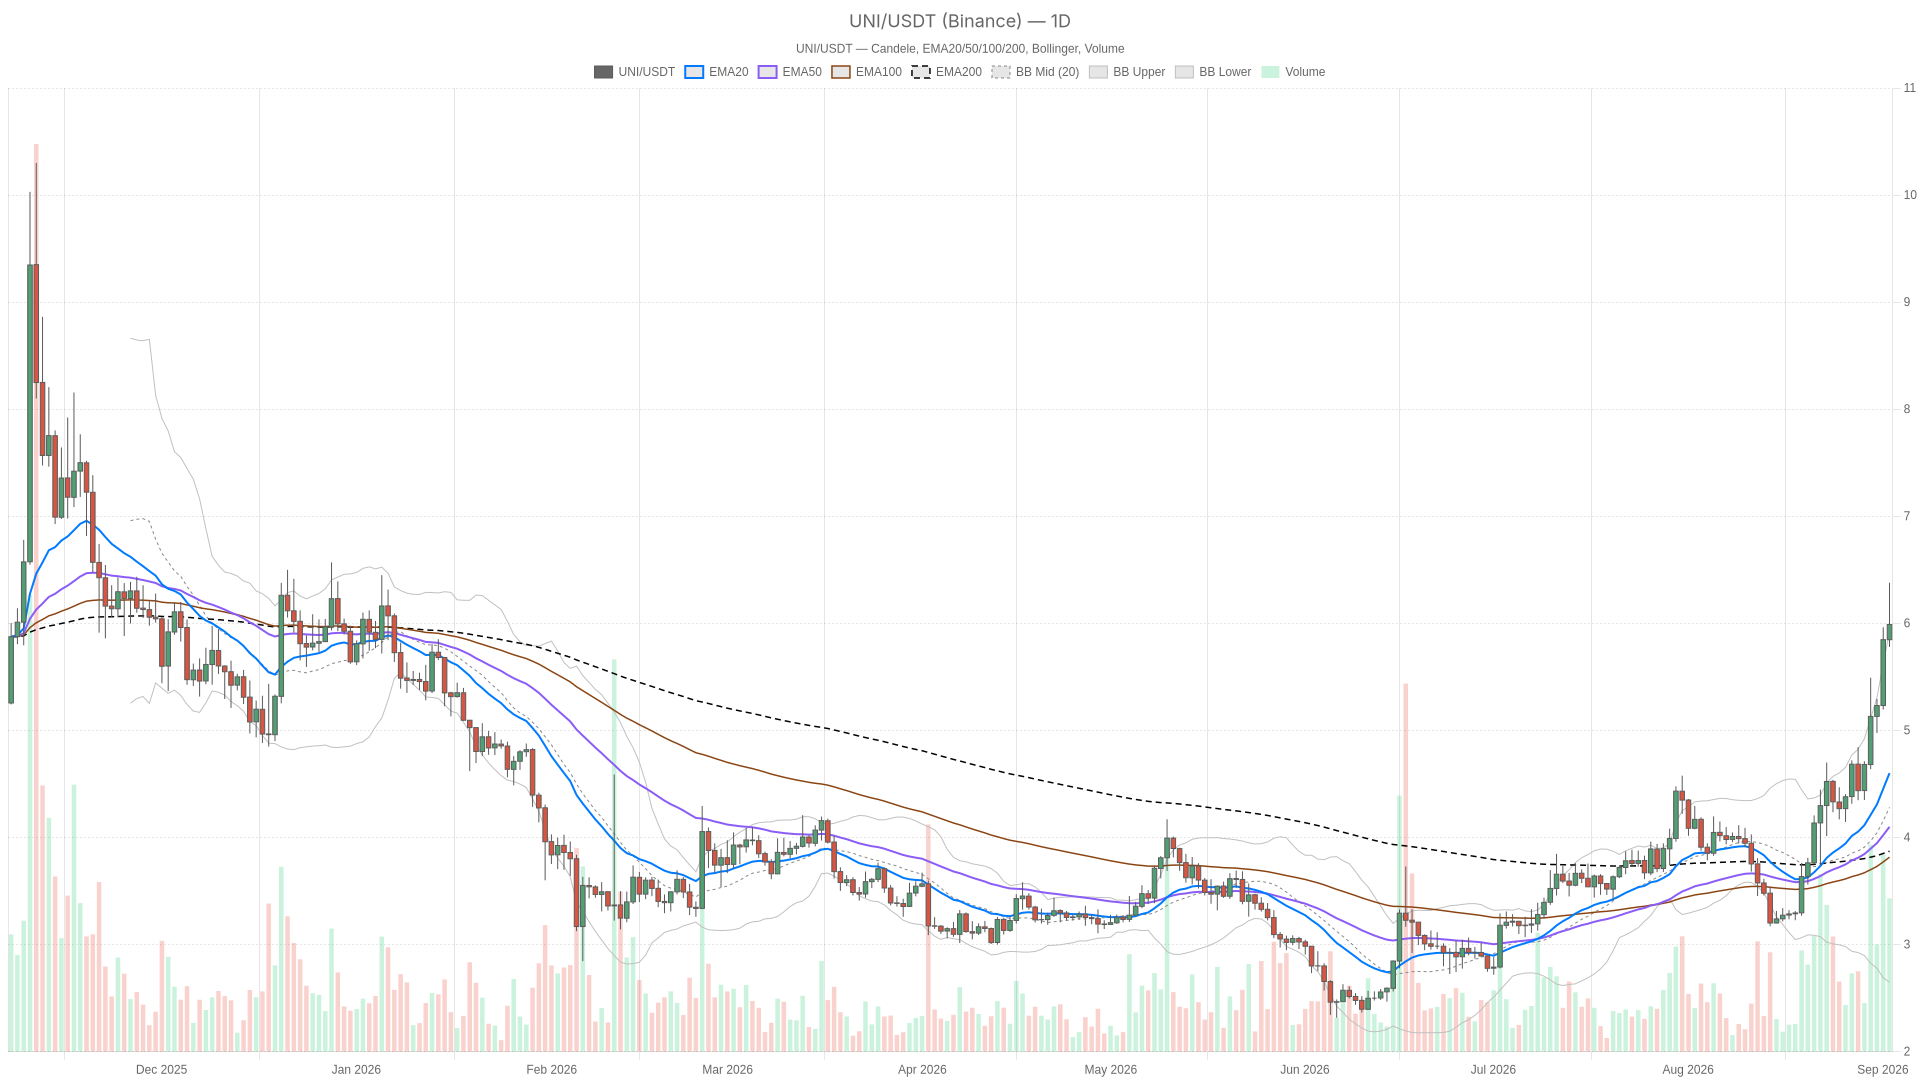
The daily timeframe presents an unambiguously bullish structure. EMA20 at 4.60 sits above EMA50 at 4.10, which sits above EMA200 at 3.87 — a clean bullish stack confirming the uptrend has been in place for some time. MACD backs this up: the line is at 0.48 against a signal of 0.29, with a histogram of 0.19 that is still expanding on the upside.
The catch is RSI at 79.38, deep into overbought territory and aligning with price trading above the upper Bollinger Band at 5.92. The mid-band sits all the way down at 4.28. When price pushes outside the bands like this, it signals either a genuine breakout extension or a sharp mean-reversion snap back toward the mid-band. ATR14 on the daily is 0.48, roughly 8% of price, confirming volatility has expanded meaningfully.
The daily pivot sits at $6.05, with resistance at $6.32 and support at $5.72. Price currently trades just under the pivot, meaning the bulls have not yet confirmed control of the session. A reclaim of 6.05 and a push through 6.32 would be needed to validate continuation.
1H Timeframe: Bullish Structure, Fading Momentum
The 1-hour chart still shows a bullish regime on paper. EMA20 at 5.97 sits above EMA50 at 5.68, which sits above EMA200 at 4.99. However, the momentum underneath is starting to lose steam. RSI has cooled to 55.07, a neutral reading far from the daily overbought extreme.
MACD tells the same story: the histogram has flipped slightly negative at -0.01, with the line at 0.16 barely below the signal at 0.17. That is not a full reversal signal, but it warns that upside thrust is fading right where it matters — directly under the H1 pivot resistance at 6.08 and the Bollinger upper band at 6.38.
Meanwhile, ATR14 on this timeframe has dropped to 0.16, a clear compression versus the daily range. This is consistent with a market pausing to digest the recent move rather than continuing it in a straight line.
15-Minute View: Short-Term Pullback in Progress
Zooming into the 15-minute chart, the picture flips to outright weak. Price is trading below both EMA20 at 6.16 and EMA50 at 6.07, RSI has dropped to 37.42, and the MACD histogram is negative at -0.05. The regime here reads more like an active pullback — price is testing the lower Bollinger Band at 6.02 and hovering just above tight intraday pivot support at 5.96.
This is where the multi-timeframe tension becomes visible. The daily trend is stretched and bullish, the hourly chart is bullish but losing steam at resistance, and the 15-minute chart is already rolling over. That is a classic pattern for a strong trend taking a breather — profit-taking on smaller timeframes inside a macro structure that has not yet broken.
Bullish Scenario
If UNI reclaims the daily pivot at 6.05 and clears resistance at 6.32, the stacked EMAs and the still-expanding daily MACD histogram argue for continuation. For Uniswap crypto, the fundamental backdrop supports this case: fee growth of 127.25% over 30 days on V3 and 99.99% on V4 reflects real protocol usage, not just speculative flow.
This scenario would be invalidated if UNI fails to hold above the 5.72 daily support. A break there would open the door toward the Bollinger mid-band around 4.28.
Bearish Scenario
The overbought RSI at 79.38 combined with price trading above the upper daily Bollinger Band represents a legitimate mean-reversion risk. Moreover, this risk is already materializing on smaller timeframes: the H1 MACD histogram turning negative and the 15-minute RSI dropping to 37.42 both point to fading short-term momentum.
Confirmation of this scenario would be a daily close below 5.72 alongside a loss of the H1 support at 5.94. That bearish read would be invalidated by a reclaim and hold above 6.32, which would reframe the overbought reading as part of a healthy trend rather than a top.
Positioning and Risk
Right now UNI presents conflicting signals depending on which timeframe is examined, and that deserves an honest assessment. The daily structure suggests trend continuation, the hourly chart shows momentum stalling at resistance, and the 15-minute view reveals a pullback already in progress.
Add in a broader market that just shed 3.39% of total capitalization while Bitcoin dominance holds near 59%, and the setup becomes even more complex. UNI’s relative strength could persist as a genuine outperformance story tied to Uniswap’s fee growth, or it could be dragged into a broader risk-off unwind if altcoin sentiment sours further.
Volatility is elevated on the daily timeframe with ATR14 at 0.48 and compressing on the lower timeframes. This pattern usually means the next directional move — in either direction — could arrive quickly. The moment calls for watching how price behaves at the 6.05–6.32 zone and the 5.72 support before drawing conclusions.
FAQ
What is the current price of UNI?
As of September 2, 2026, UNI is trading at $5.99, sitting just below the daily pivot of $6.05.
Is UNI overbought on the daily chart?
Yes, the daily RSI stands at 79.38, which is deep into overbought territory. Price is also trading above the upper Bollinger Band at $5.92, reinforcing the stretched condition.
What are the key support and resistance levels?
The daily pivot sits at $6.05, with resistance at $6.32 and support at $5.72. On the 1-hour chart, resistance stands at $6.08 with support at $5.94.
How are protocol fees affecting the Uniswap token?
Uniswap V3 recorded a 127.25% fee increase over 30 days, while V4 posted 99.99%. These figures reflect genuine protocol usage that provides a fundamental tailwind, though the 7-day data shows cooling of 12.6% and 26.77% respectively.
Disclaimer: This article is for informational purposes only and does not constitute financial advice, an investment recommendation, or a solicitation to buy or sell any financial instrument or cryptocurrency. The analysis provided is not indicative of future results. Investing in crypto assets and financial markets carries a high risk of capital loss. Always do your own research (DYOR) and consult a qualified financial advisor before making any decision.
Article produced with the assistance of artificial intelligence and reviewed by the editorial team.
