




As of September 2, 2026, the Bitcoin crypto market is navigating a sharp pullback after last week’s push above $80,000, with BTCUSDT now changing hands near $76,660. The daily uptrend remains intact even as hourly charts flash clear seller dominance, creating a tense tug-of-war between conflicting timeframes.
Summary
Key takeaways
- BTCUSDT trades near $76,660, down from last week’s high above $80,000, yet still above all three daily EMAs.
- Daily EMA structure remains bullish: EMA20 at $74,587, EMA50 at $70,272, and EMA200 at $72,121.
- Hourly and 15-minute charts show a fully bearish EMA stack with RSI readings in the low 30s that still have room to extend lower.
- Bitcoin dominance has climbed to 59.09% during the drawdown, signaling defensive rotation toward BTC rather than a broad exit.
- Fear & Greed Index still reads 63 (Greed), creating a gap between sentiment and the cooling tape that warrants close attention.
Daily Chart: Uptrend Structure Holds Despite Fading Momentum
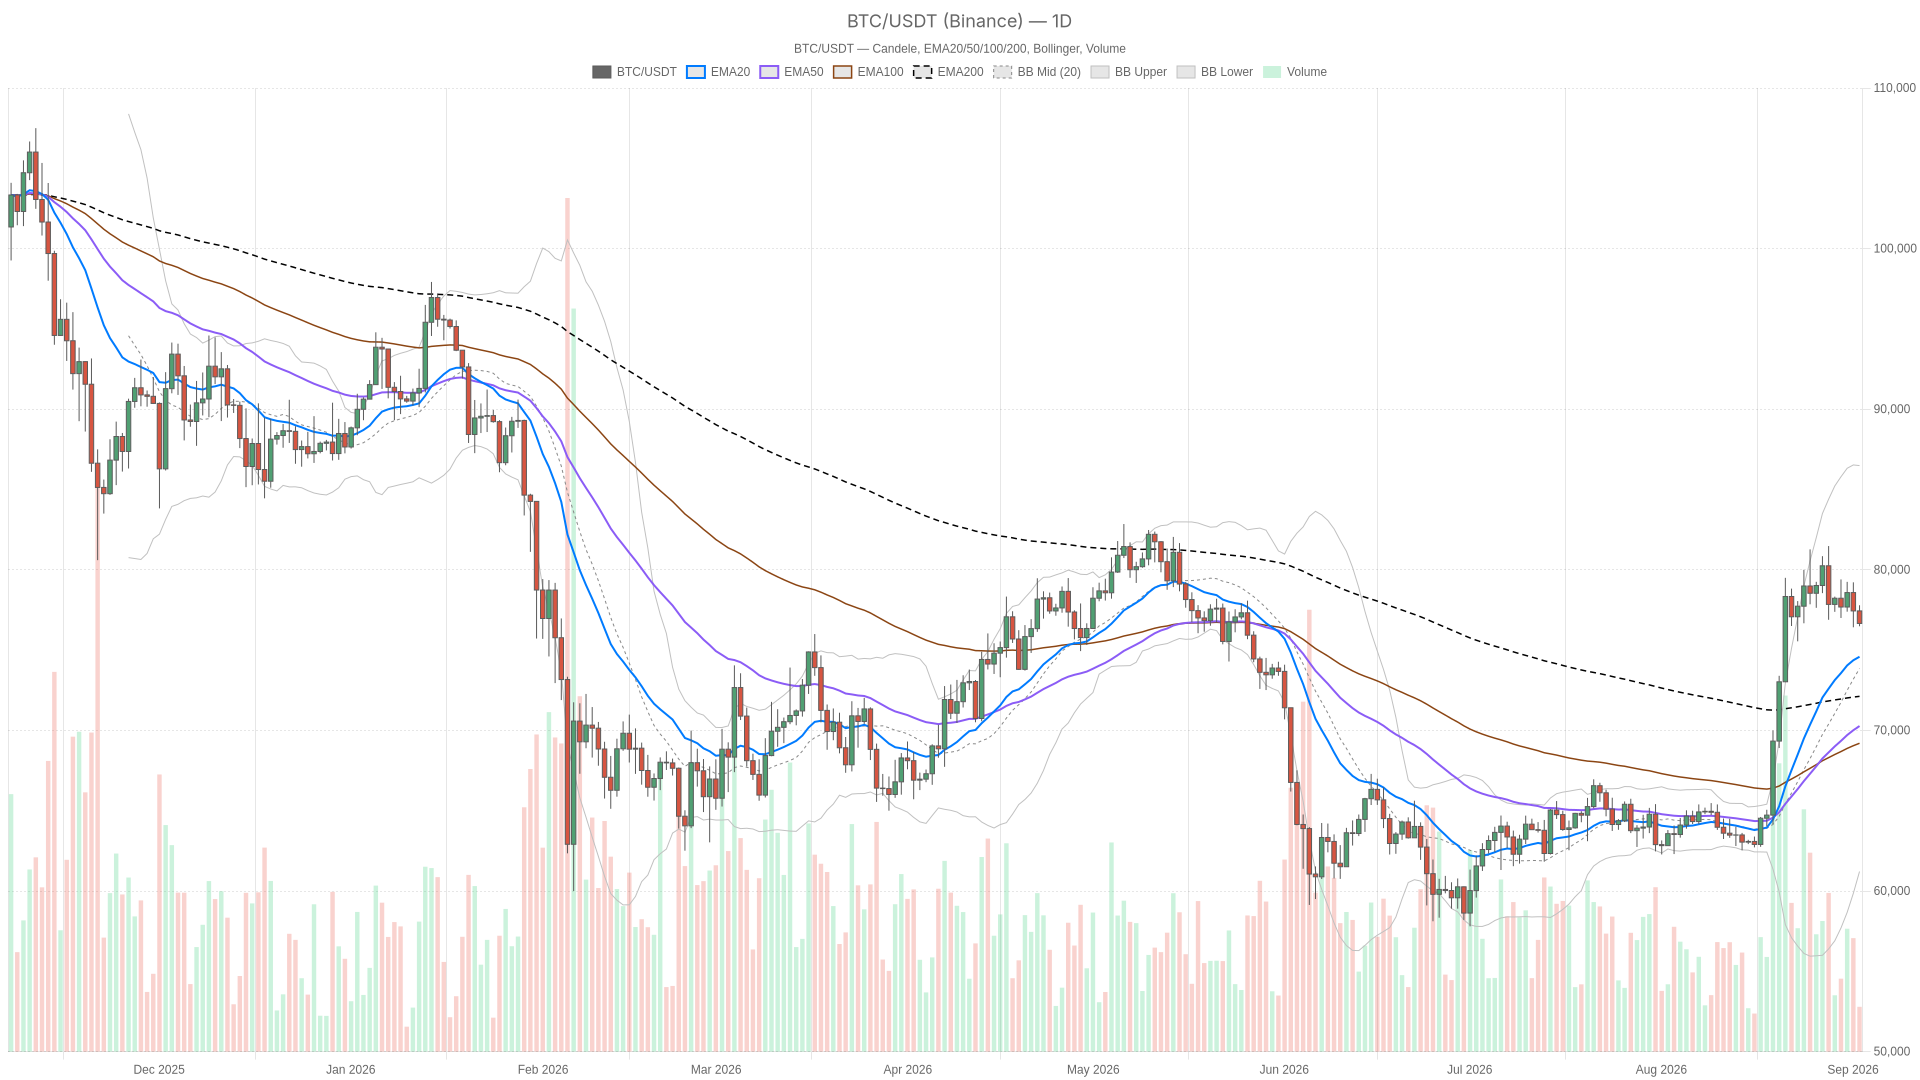
The daily uptrend structure remains intact — price at $76,659.68 still holds above all three key moving averages, keeping the broader bullish bias alive. EMA20 sits at $74,587.22, EMA50 at $70,272.44, and EMA200 at $72,120.81. That stacked order is textbook uptrend structure and explains why the macro bias has not broken despite the slide from above $80,000.
RSI14 at 62.39 backs that up — firmly on the bullish side of neutral without nearing overbought exhaustion, which means there is still room for this move to run in either direction. However, the MACD tells a more cautious story: the line reads 3,317.46 against a signal of 3,453.09, producing a negative histogram of -135.63. That is a classic case of price holding structure while momentum quietly rolls over underneath it.
The daily Bollinger Bands, with a mid at $73,851.85, upper at $86,488.91, and lower at $61,214.80, are wide and price sits comfortably in the upper-middle zone. No squeeze, no exhaustion tag. ATR14 at $2,884.69 gives a sense of scale — daily ranges of that size are the current norm, so a swing of a few thousand dollars in either direction should not be mistaken for a trend change by itself. As for the daily pivot cluster, PP at $76,978.77, R1 at $77,472.91, and S1 at $76,165.55, current price is sitting just under the pivot point, putting the immediate battle between reclaiming that pivot or testing S1 first.
Hourly and 15-Minute Charts: Sellers Have Seized Short-Term Control
On intraday timeframes, sellers have decisively taken control — price at $76,659.68 now trades below EMA20 ($77,378.36), EMA50 ($77,778.78), and EMA200 ($77,958.19) on the 1H chart, forming a fully bearish stack. RSI14 has fallen to 32.36, edging toward oversold without quite tipping into it, suggesting sellers still have room to push before this gets stretched. The hourly MACD confirms the bearish tilt remains active, not merely a brief dip.
Price is hugging the lower Bollinger Band ($76,695.47) on the hourly, which is typical of a sharp, decisive intraday move rather than a slow drift. ATR14 on the hourly at $428.61 points to elevated short-term volatility relative to recent norms. Notably, the 15-minute chart largely mirrors this picture, but with a MACD histogram of -85.15 that is actually wider than the hourly reading — meaning selling pressure is, if anything, accelerating on the smallest timeframe. For execution purposes, price is compressing right around the 15m pivot ($76,654.99), which usually precedes a directional push rather than more sideways drift.
Market Backdrop: Dominance Climbs as the Broader Market Cools
Bitcoin dominance has risen to 59.09% during the pullback, signaling capital is rotating toward BTC rather than exiting the crypto space entirely. The total crypto market cap sits at roughly $2.6 trillion, down 3.39% over 24 hours, yet BTC is gaining relative share. That is a meaningful distinction: this looks more like a defensive rotation within the Bitcoin crypto ecosystem than a broad risk-off exit.
Sentiment has not caught up to price action yet. The Fear & Greed Index reads 63, still classified as Greed, even as the market cap contracts and BTC pulls back from recent highs. That gap between still-optimistic sentiment and a cooling tape is worth watching — greed readings that persist through a pullback can either resolve into renewed buying if the dip gets bought, or set up a sharper flush if that optimism unwinds all at once. Meanwhile, the context from late August matters: Bloomberg reported BTC retaking $80,000 amid fresh demand signals, and Michael Saylor’s Strategy made its first purchase in two months, confirming large accumulators are re-engaging.
Bullish Scenario
The bull case remains valid as long as price holds above daily S1 at $76,165.55 and, more importantly, above the daily EMA20 at $74,587.22. Under those conditions, this reads as a normal pullback inside a larger uptrend — not a trend change. A reclaim of the hourly EMA20 at $77,378.36 alongside the daily pivot at $76,978.77 would be the first sign that buyers are stepping back in. That would open a path toward R1 at $77,472.91 and, from there, a retest of the $80,000 area Bitcoin was trading at just last week. What would invalidate this outlook: a daily close below the EMA20 at $74,587.22 would break the current structure and shift focus toward the daily EMA50 near $70,272.44 or the Bollinger mid-band at $73,851.85.
Bearish Scenario
The bear case draws support from what is actually happening right now on intraday charts — a clean bearish EMA stack, negative MACD histograms on both the hourly and 15-minute timeframes, and RSI readings in the low 30s that have yet to hit oversold extremes, meaning there is still room for this leg to extend. A break below daily S1 at $76,165.55 would confirm sellers are pushing this into a deeper mean-reversion move, with the daily EMA50 at $70,272.44 or the Bollinger mid at $73,851.85 as logical downside references. What would invalidate the bearish case: a reclaim of the hourly EMA200 at $77,958.19 and the 15m EMA200 at $77,806.92, paired with RSI pushing back above 50 on both intraday timeframes, would flip the short-term bias back in line with the still-intact daily uptrend.
Positioning Amid Conflicting Signals
This is a market where daily and intraday charts genuinely disagree, and position sizing should account for the elevated short-term volatility rather than assuming the calm of recent weeks continues unchanged. The daily structure — price above all three EMAs, RSI in the low 60s, no Bollinger extremes — still favors the broader uptrend narrative supported by real ETF inflows and renewed institutional buying. But the hourly and 15-minute charts are unambiguously bearish right now, with sellers pressing price against the lower bands and momentum still expanding to the downside on the smallest timeframe.
The ATR readings across timeframes — roughly $2,884 on the daily and $428 on the hourly — are a useful reminder that moves of this size currently fall within normal range rather than signaling something broken. Given the Greed sentiment reading against a market cap down over 3% in a day, and Bitcoin dominance climbing while altcoins take the harder hit, this looks like a market in the middle of sorting itself out rather than one that has made up its mind. Anyone watching this pair should pay closer attention to whether the daily S1 and EMA20 levels hold than to any single indicator in isolation.
FAQ
Is the Bitcoin daily uptrend still intact?
Yes. Price at $76,659.68 remains above EMA20 ($74,587.22), EMA50 ($70,272.44), and EMA200 ($72,120.81) on the daily chart. This stacked bullish EMA order is the structural backbone of the ongoing uptrend, and it has not broken despite the pullback from above $80,000.
What are the most important support levels to watch?
The immediate line in the sand is daily S1 at $76,165.55. Below that, the daily EMA20 at $74,587.22 is the level that, if broken on a daily close, would shift the conversation from a healthy pullback to a potential trend change. Further down, the Bollinger mid-band at $73,851.85 and the daily EMA50 at $70,272.44 serve as secondary support references.
Why is Bitcoin dominance rising while the market pulls back?
Bitcoin dominance has climbed to 59.09% during the drawdown because capital is rotating defensively toward BTC relative to altcoins rather than exiting crypto entirely. The total market cap is down 3.39%, but Bitcoin is losing less ground than the rest of the market, signaling a flight-to-quality move within the crypto space.
What would signal that buyers have regained control?
A reclaim of the hourly EMA20 at $77,378.36 alongside the daily pivot at $76,978.77 would be the first sign of buyers stepping back in. For a more convincing shift, a push above the hourly EMA200 at $77,958.19 paired with RSI moving back above 50 on intraday timeframes would align the short-term bias with the still-intact daily uptrend.
Disclaimer: This article is for informational purposes only and does not constitute financial advice, an investment recommendation, or a solicitation to buy or sell any financial instrument or cryptocurrency. The analysis provided is not indicative of future results. Investing in crypto assets and financial markets carries a high risk of capital loss. Always do your own research (DYOR) and consult a qualified financial advisor before making any decision.
Article produced with the assistance of artificial intelligence and reviewed by the editorial team.
