



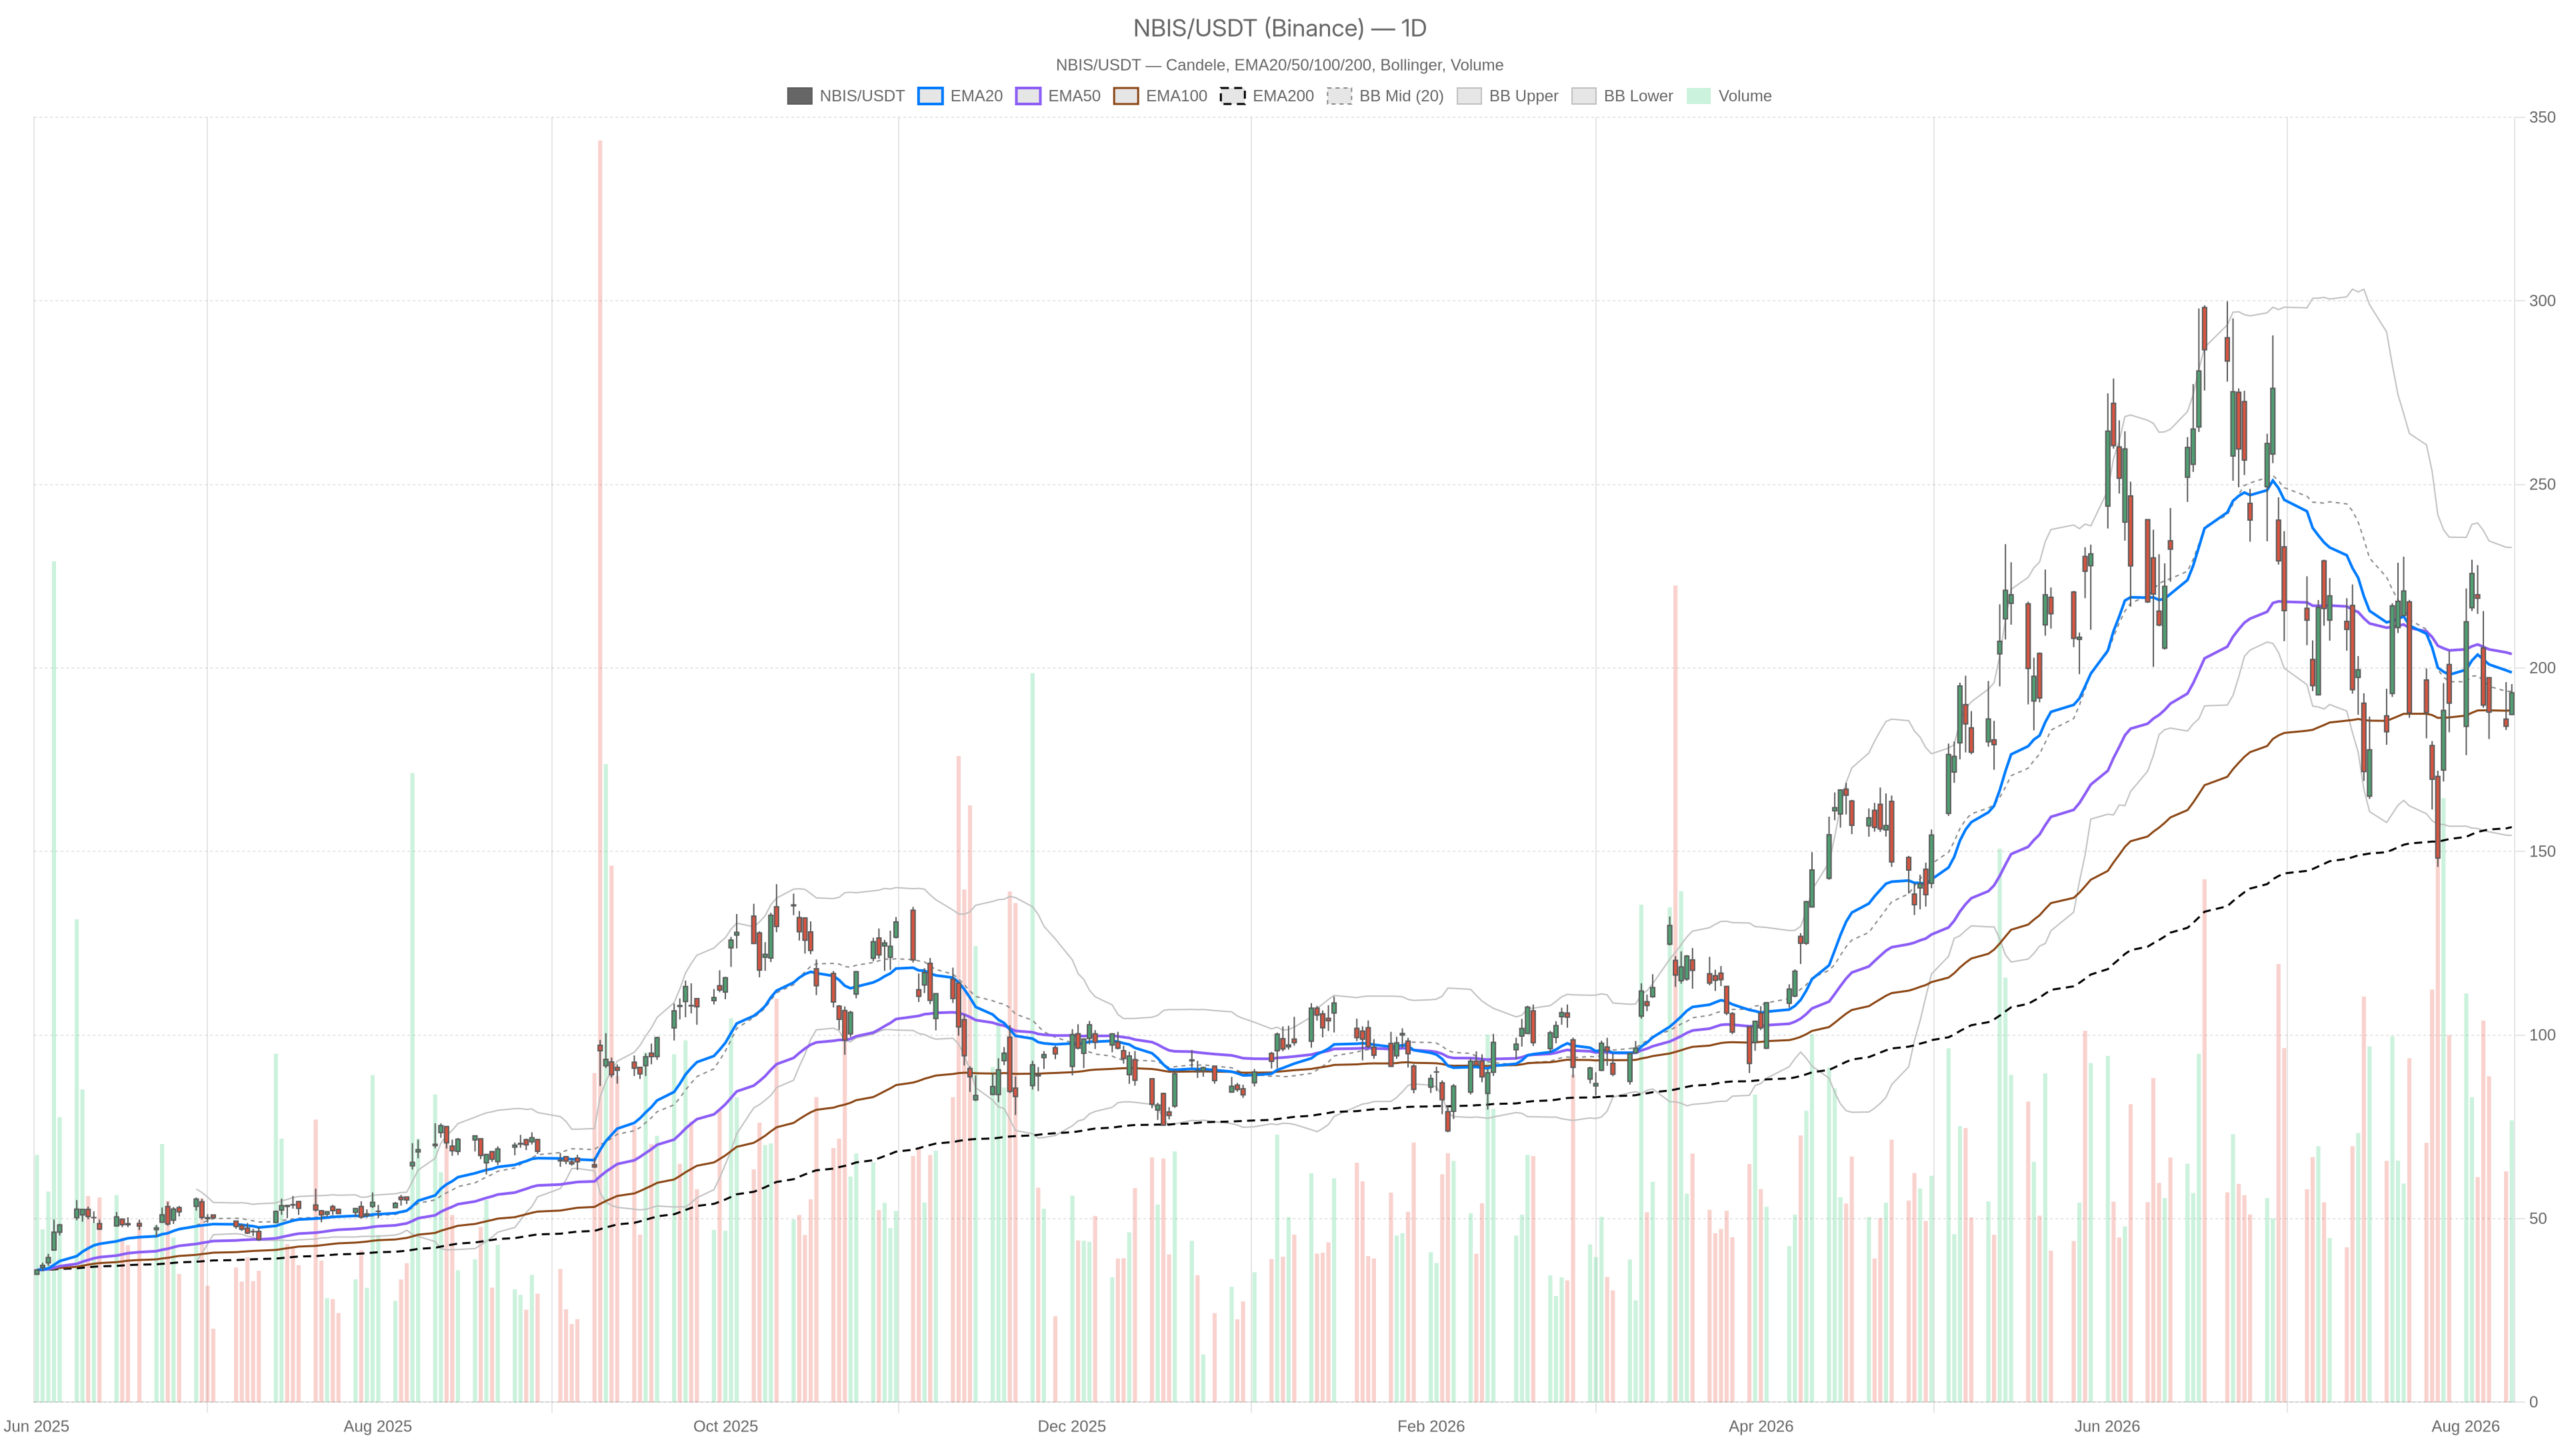
Nebius Group N.V. stock enters its Q2 print in a genuine standoff. Price closed at 193.23 on 11 August, nearly on the daily Bollinger midline at 193.63. The daily chart has cooled from a strong trend into a wide, indecisive range. That is balance, not conviction.
Summary
Key takeaways
- NBIS closed at 193.23 on 11 August, sitting precisely on the daily Bollinger midline at 193.63.
- Daily ATR at 24.20 signals extreme volatility — roughly one-eighth of the share price in average daily range.
- Q2 earnings on 12 August are the decisive catalyst, with the stock coiled between 188.49 and 196.78.
- Michael Burry holds a disclosed short position at 211.77, well above current levels.
- The long-term uptrend remains intact above the 200-day EMA at 156.66, but the 20-day and 50-day EMAs have turned bearish.
What the Daily Structure Says About Nebius Group N.V. Stock
Nebius Group N.V. stock sits in a wide, indecisive range with no clear directional control. Momentum indicators flash neutral, while extreme volatility makes any tight framework unreliable.
The last daily candle is encouraging in isolation. It opened at 187.31, printed its low at the open, then pushed to 195.60 before settling at 193.23. Buyers defended the lower half of the range. That is a full-body recovery from the session low.
Momentum Indicators Stay Neutral
Momentum, however, is still repairing rather than leading. Daily RSI at 47.55 sits just under the neutral line. There is no oversold rebound to lean on and no overbought risk either. The reading is honest: neither side controls the tape.
Meanwhile, MACD tells a similar story with a slightly better tone. The line at -5.98 remains below zero, confirming the intermediate downshift. Yet the signal line is lower at -7.05. This leaves a positive histogram of 1.07. Selling pressure is decelerating, but the trend has not turned.
Extreme Volatility Defines the Setup
Notably, volatility is the real headline. Daily ATR at 24.20 is enormous relative to a 193 handle. That is roughly one-eighth of the share price in average daily range. The Bollinger envelope reflects the same reality, stretching from 154.41 to 232.84. Any framework built on tight levels will be overwhelmed by that kind of expansion.
Daily pivots keep the immediate battlefield narrow. The pivot point at 192.05 is now support. R1 sits at 196.78 and S1 at 188.49. Notably, the close sits between pivot and R1. That is the classic location for indecision ahead of a catalyst.
How the 1H Chart Complicates the Picture
The intraday structure adds nuance but no confirmation. Price has reclaimed the 20-period EMA, yet overhead resistance remains firmly in place.
On the 1H chart, price at 192.81 has reclaimed the 20-period EMA at 191.85. However, the 50-period EMA at 195.85 and the 200-period EMA at 204.35 both sit overhead. That is a stacked bearish sequence, and it caps rallies.
Bearish EMA Stack Caps Rally Potential
At the same time, the hourly Bollinger picture shows a market pressing its upper band. The mid sits at 188.70 and the upper band at 193.61. The close is just beneath it. The recovery has already used up most of its short-term room. Continuation from here requires the bands to expand, not simply for price to grind higher.
Hourly Momentum Mirrors the Daily
Meanwhile, hourly momentum mirrors the daily indecision. RSI at 49.17 is neutral. MACD at -2.56 remains below its signal at -3.87, yet the histogram is positive at 1.31. The bounce is real, but it is a bounce inside a lower-timeframe downtrend. Hourly ATR of 4.55 also warns that a single candle can erase several pivot levels.
15-Minute Context: Execution, Not Conviction
The 15-minute chart is the only timeframe where bulls are clearly in control. Price sits above both the 20-period EMA at 190.71 and the 50-period at 190.54. RSI at 59.98 shows firm but not extreme demand. MACD is positive at 0.61 against a 0.52 signal.
Even so, the 200-period EMA at 195.28 marks the ceiling of this micro recovery. Short-term ATR of 1.61 keeps the noise manageable for timing purposes. Shared pivots across both intraday frames give a clean map. First support sits at 190.72, the fulcrum at 192.61, and first resistance at 194.70.
The Bullish Case for Nebius Group N.V. Stock
The bullish path is straightforward but demanding. Bulls need acceptance above the 194.70 pivot resistance. From there, a push through the 196.78 daily R1 would open the door higher.
Beyond that, the 1H 50-period EMA at 195.85 and the daily 20-day EMA at 198.78 form the first serious supply zone. Fundamentally, the narrative support is already visible. Options traders have been positioning ahead of the 12 August Q2 report. Sell-side commentary has framed AI infrastructure growth, Meta-related deals and NVIDIA backing as the core bull thesis. A strong print validating that demand story would give the daily MACD crossover something to work with.
The Bearish Case
The bearish argument is arguably cleaner on the chart. Price is below both the 20- and 50-day EMAs. The 1H EMA stack is fully bearish. A rejection at the hourly upper band near 193.61 would put the daily S1 at 188.49 back in play quickly. A loss of 190.72 would accelerate that move.
Michael Burry’s disclosed short at 211.77 sits well above current levels. It is framed alongside concerns over leverage and off-balance-sheet risk in tech and cloud names. That bearish position is already profitable on paper. This sharpens the reflexive risk around any disappointing guidance.
Meanwhile, the counter-argument centres on capacity timing, investment-driven margin pressure and a stretched valuation. The bullish case is invalidated on a decisive daily close below the 188.49 pivot support and the recent 187.31 low. From there, the daily Bollinger lower band at 154.41 defines how much air exists beneath the market. Given an ATR of 24.20, that distance can be covered faster than most position sizing assumes.
Positioning Into the Q2 Print
Overall, this is a mixed tape, and it should be treated as such. The long-term trend still favours the upside. The intermediate trend does not. The intraday frames are simply recovering into resistance. Signals genuinely conflict across timeframes, and that conflict is the message.
Therefore, the decisive variable is not an indicator but the Q2 release on 12 August. Nebius Group N.V. stock is coiled between 188.49 and 196.78. Volatility metrics dwarf that range. Until price resolves outside those pivots on a daily close, any directional conviction is borrowed rather than earned.
FAQ
What is the current technical outlook for Nebius Group N.V. stock?
The outlook is neutral in the short term but constructive over the longer horizon. Price sits at 193.23, virtually on the daily Bollinger midline at 193.63. The 200-day EMA at 156.66 supports the long-term uptrend. However, the 20-day EMA at 198.78 and the 50-day EMA at 203.81 are both above price, confirming an intermediate downtrend.
What are the key levels to watch for Nebius Group N.V. stock?
The critical range spans from daily S1 at 188.49 to daily R1 at 196.78. On the intraday frame, first support is 190.72, the fulcrum is 192.61, and first resistance is 194.70. A daily close outside the 188.49–196.78 range would signal the next directional move.
When are Nebius Group N.V. earnings and why do they matter?
Nebius Group N.V. reports Q2 earnings on 12 August. The stock is tightly coiled between pivot levels with extreme volatility metrics. The ATR of 24.20 dwarfs the 188.49–196.78 range. Earnings are the catalyst most likely to force a resolution.
What is Michael Burry’s position on Nebius Group N.V. stock?
Michael Burry has disclosed a short position at 211.77, well above the current 193.23 price. The position is framed around concerns over leverage and off-balance-sheet risk in tech and cloud names. It is already profitable on paper, which adds reflexive pressure around any disappointing guidance.
Disclaimer: This article is for informational purposes only and does not constitute financial advice, an investment recommendation, or a solicitation to buy or sell any financial instrument or cryptocurrency. The analysis provided is not indicative of future results. Investing in crypto assets and financial markets carries a high risk of capital loss. Always do your own research (DYOR) and consult a qualified financial advisor before making any decision.
Article produced with the assistance of artificial intelligence and reviewed by the editorial team.
