



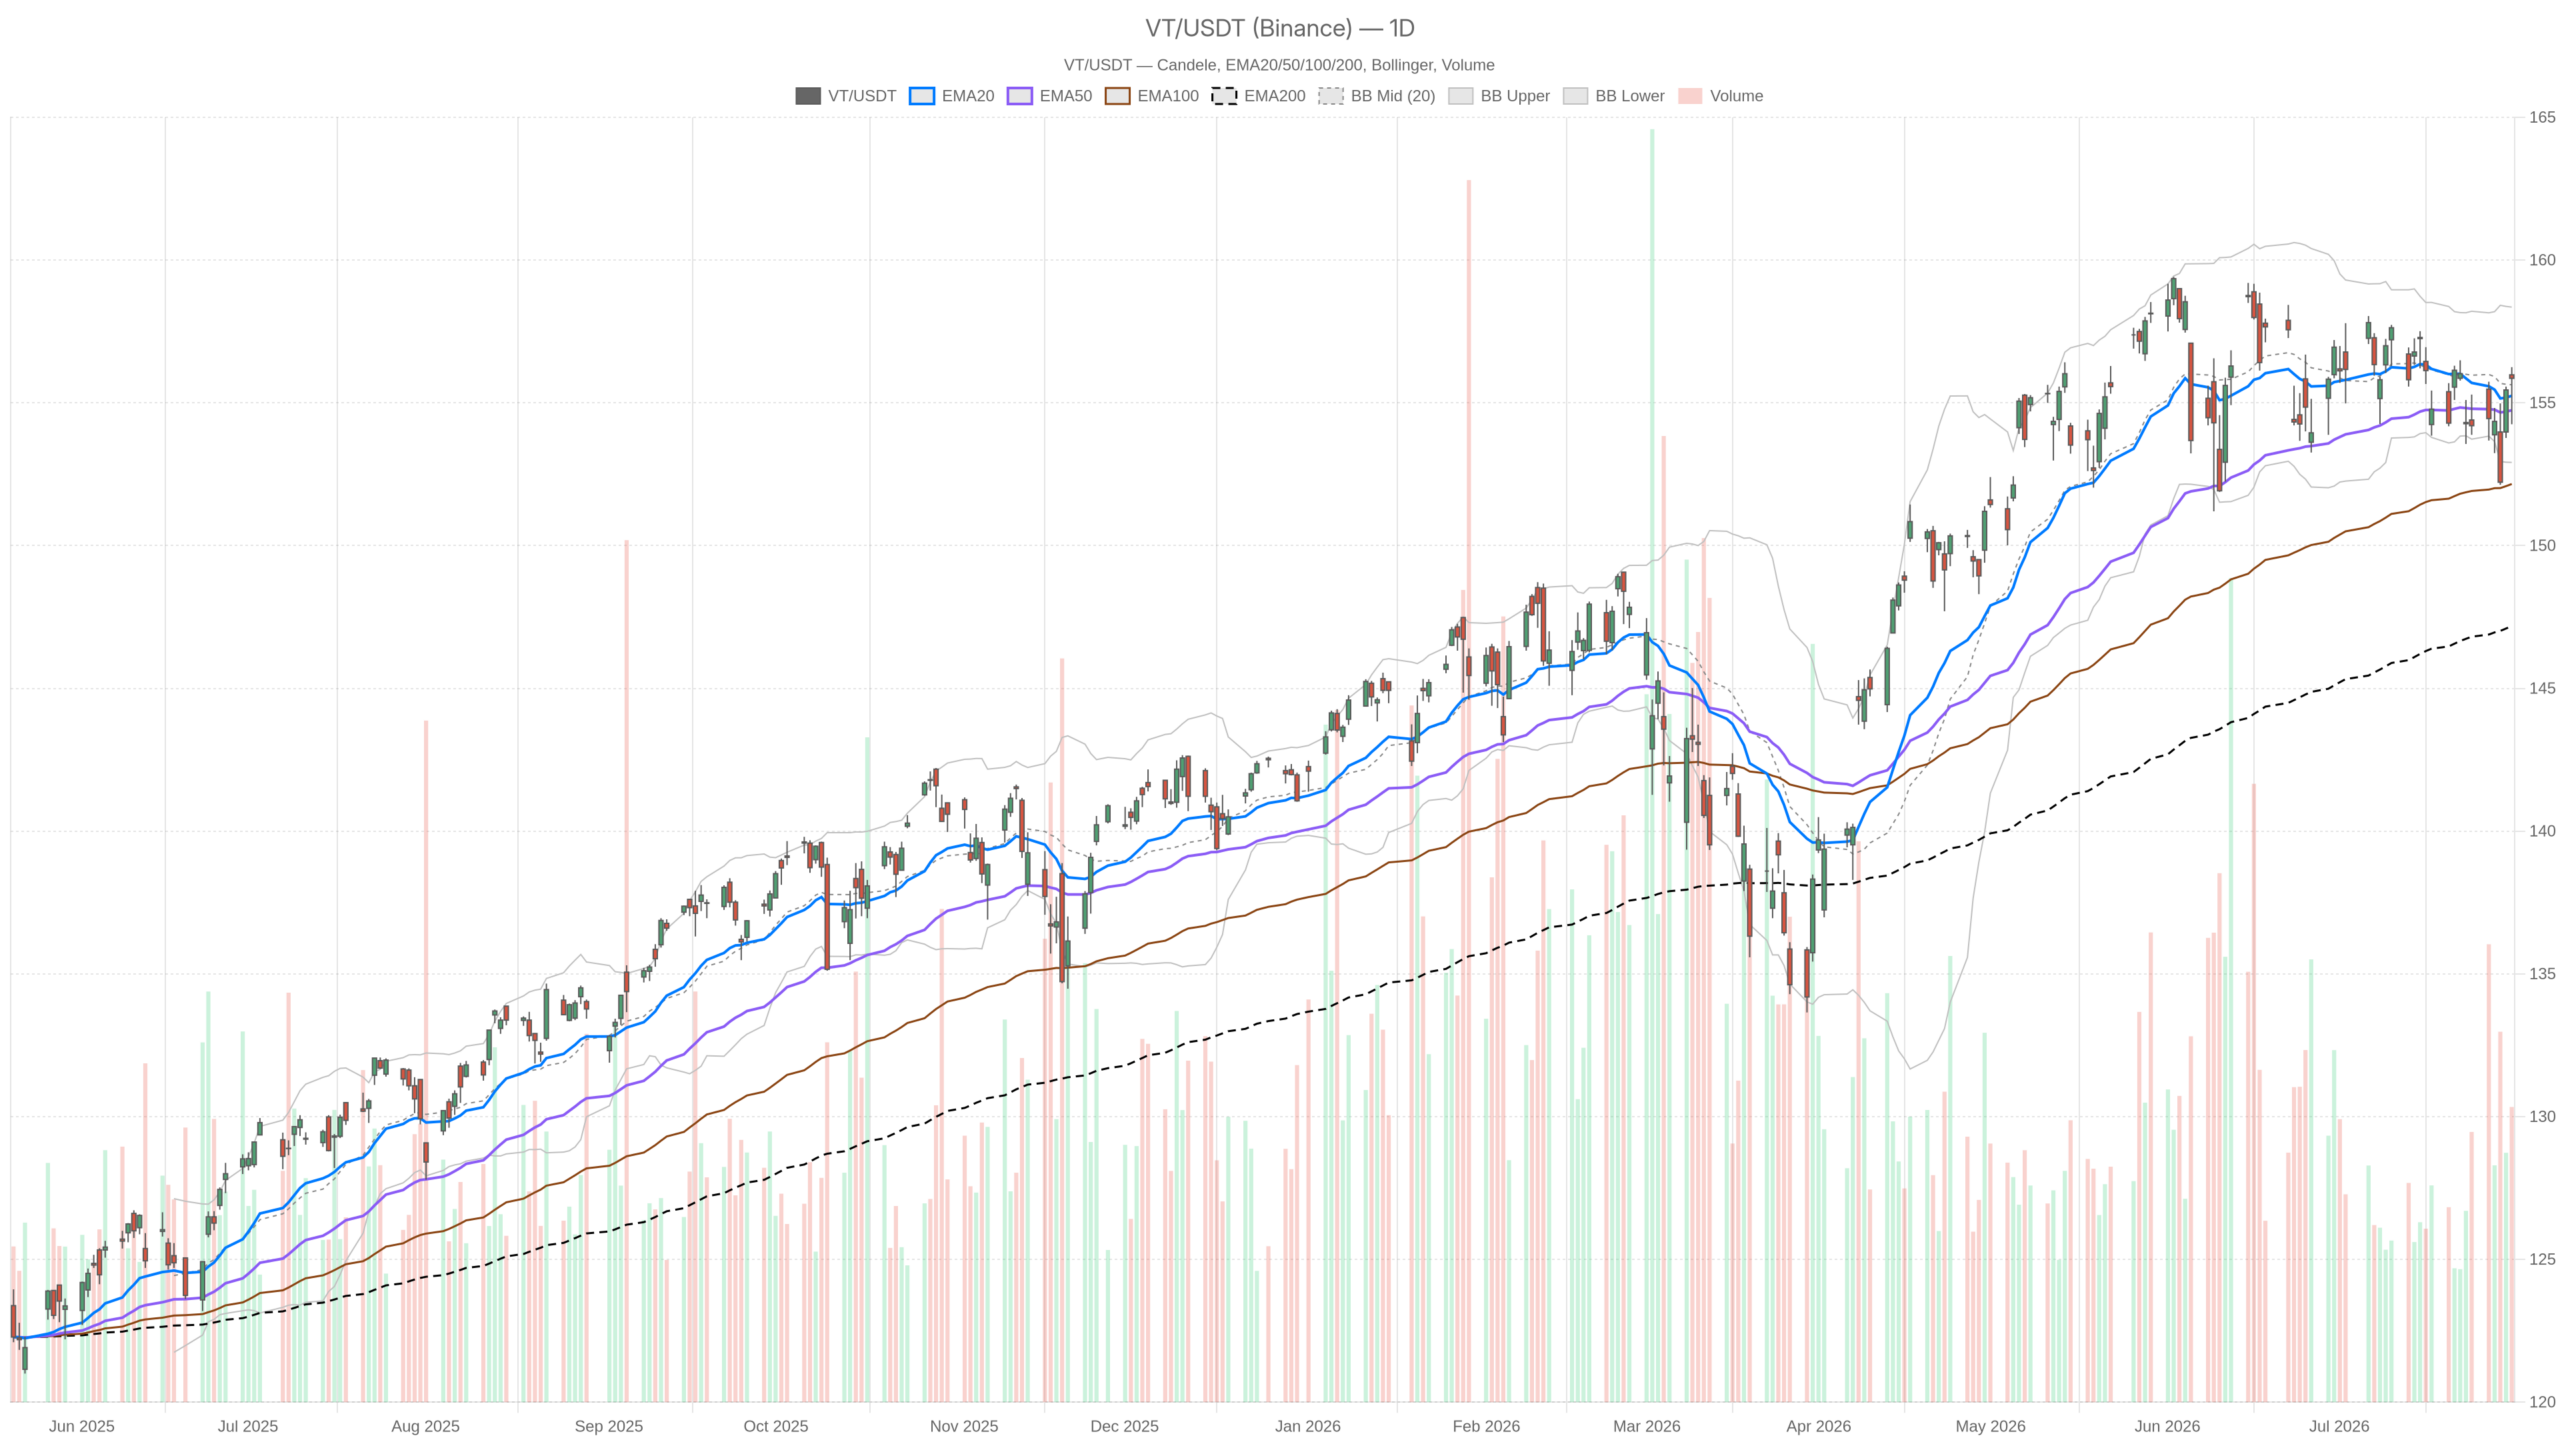
The Vanguard Total World Stock Index stock (VT) closed Friday at 155.86, holding above its key daily moving averages. The EMA20 (155.25), EMA50 (154.74), and EMA200 (147.18) remain stacked in bullish alignment, anchoring an established uptrend. Yet short-term momentum shows early signs of fatigue.
Summary
Key takeaways
- VT closed at 155.86, above its EMA20 (155.25), EMA50 (154.74), and EMA200 (147.18), confirming a structurally bullish trend.
- Daily RSI14 sits at a neutral 51.85, leaving room for movement in either direction without immediate technical exhaustion.
- Daily MACD histogram reads -0.09, signaling cooling momentum despite the intact uptrend.
- The daily pivot structure defines key levels: support at S1 (154.66), resistance at R1 (156.66), with the pivot at 155.45.
- Short-term Bollinger Bands are compressing, pointing to a market coiling before its next directional decision.
Daily Trend Remains Bullish for Vanguard Total World Stock Index Stock
The daily chart for the Vanguard Total World Stock Index stock paints a structurally bullish picture. Price closed Friday at 155.86, firmly above the EMA20 (155.25), EMA50 (154.74), and EMA200 (147.18). This stacked alignment of moving averages is the classic signature of an established uptrend. It serves as the anchor for VT’s broader bullish bias.
However, the picture is not entirely one-sided. The daily regime tag reads bullish, yet the MACD line sits at -0.33 against a signal line of -0.23. That produces a negative histogram of -0.09, meaning momentum has softened even while the trend structure itself stays intact. It is a common pattern late in a rally: price holds above key averages, but the engine underneath loses some thrust.
Momentum Indicators Flash Caution
Meanwhile, RSI14 on the daily timeframe sits at 51.85, essentially neutral. That reading matters because VT is neither overbought nor oversold at current levels. There is room to move in either direction without technical exhaustion getting in the way immediately. The daily MACD’s negative histogram confirms that buying pressure has faded from earlier levels, though it has not yet turned into outright bearish momentum.
Volatility and Pivot Levels Frame the Range
The Bollinger Bands frame the range clearly: mid-band at 155.63, upper band at 158.35, lower band at 152.91. Price currently hugs the midline, reflecting mild consolidation rather than a decisive push toward either extreme. Daily ATR14 stands at 1.90, a moderate reading that does not suggest an imminent breakout or breakdown.
The daily pivot structure reinforces this. The pivot point sits at 155.45, with resistance R1 at 156.66 and support S1 at 154.66. Overall, the daily tape describes a market that is bullish by trend but pausing by momentum. It is caught between its rising EMA200 far below and a compressed range just under the pivot’s resistance zone.
Intraday Timeframes Send Mixed Signals
1-Hour Chart: Stronger Momentum, Neutral Regime
On the 1-hour chart, momentum indicators actually look stronger than the daily. RSI14 reads 59.48, and MACD shows a clearly positive histogram of 0.17. The MACD line at 0.46 sits above the signal at 0.29, painting a more energetic profile. Yet the H1 regime is tagged neutral, and price at 155.83 sits almost exactly at the H1 EMA200 of 155.62.
In other words, the H1 timeframe partially confirms daily bullishness through stronger momentum readings. But the neutral regime and tight clustering around the EMA200 complicate the picture. This is a market testing a key intraday reference point rather than trending decisively. Price hovers near the H1 pivot of 155.96, with R1 at 156.12 and S1 at 155.67—further underscoring a tight decision zone.
15-Minute View: Compression Before a Move
Zooming into the 15-minute chart, VT trades at 155.83, above its EMA20 (155.72), EMA50 (155.24), and EMA200 (154.81). That keeps the short-term structure technically bullish. At the same time, the MACD histogram on this timeframe has turned slightly negative at -0.01. The MACD line (0.24) sits just below the signal (0.25), a subtle but real sign of stalling momentum into the session close.
Meanwhile, RSI14 at 56.09 is unremarkable, and the Bollinger Bands are notably tight. The upper band rests at 156.29, the lower band at 155.10, and the mid-band at 155.70. This compression suggests the market is coiling near resistance. It is consistent with a pause rather than a reversal and frames the immediate execution zone between 15m support near 155.10 and resistance near 156.29.
Bullish Scenario for VT Stock
For the bullish case to extend, VT needs to hold above the daily EMA20 (155.25) and the daily pivot (155.45). A clean move through the daily R1 at 156.66 would then open the door to the upper Bollinger Band at 158.35. That sequence would confirm renewed momentum and validate the broader uptrend anchored by the EMA200 at 147.18.
Ideally, this would come alongside RSI moving from its neutral 51.85 zone toward the 60s without becoming stretched. The daily MACD histogram would also need to flip back positive. On shorter timeframes, a hold above the H1 EMA200 (155.62) and a break of the 15m resistance near 156.29 would add tactical confirmation to the bullish thesis.
Bearish Scenario and Invalidation
In contrast, the bearish risk centers on a breakdown through daily support at S1 (154.66). That level sits close to the daily EMA50 (154.74), and a decisive close below this zone would undercut the trend structure. That structure has held since price climbed well above the EMA200. Should it break, the lower daily Bollinger Band at 152.91 becomes the next reasonable reference point.
On intraday timeframes, a drop back below the H1 EMA200 (155.62) and the 15m EMA50 (155.24) would signal that the current momentum softness is translating into an actual reversal. That combination—a daily close below 154.66 paired with intraday EMA breaks—would be the clearest technical invalidation of the bullish case.
VT Stock Technical Outlook
VT sits at a technically sensitive juncture. The daily trend remains bullish by structure, but momentum has cooled. Both the 1-hour and 15-minute charts show signs of consolidation rather than conviction, leaving the stock poised between continuation and pullback.
Away from the chart, the broader Vanguard ETF lineup has drawn attention in recent coverage. Reports have highlighted fee competition from rivals, comparisons between growth-focused and broad-market products, and disclosures around VTI’s exposure to newly listed names. These stories center on sibling funds rather than VT itself, but they reflect a competitive landscape across diversified index products.
Positioning here calls for patience. The range between roughly 154.66 and 156.66 on the daily chart looks like the near-term battlefield. How VT resolves that range should clarify whether the underlying uptrend reasserts itself or gives way to a deeper pullback. Given the mixed momentum signals across timeframes, uncertainty remains elevated, and confirmation from price action itself will matter more than any single indicator in isolation.
FAQ
Is VT stock still in a bullish trend?
Yes. VT closed Friday at 155.86, above its EMA20 (155.25), EMA50 (154.74), and EMA200 (147.18). This stacked moving average alignment is the hallmark of an established uptrend and remains the structural anchor for VT’s bullish bias.
What are the key support and resistance levels for VT?
Daily support sits at S1 (154.66), close to the EMA50 (154.74), with the lower Bollinger Band at 152.91 as the next reference. Daily resistance is at R1 (156.66), followed by the upper Bollinger Band at 158.35. On the H1 timeframe, the pivot at 155.96 and EMA200 at 155.62 are also key reference points.
Is momentum fading on VT despite the bullish trend?
Yes. The daily MACD histogram reads -0.09, with the MACD line (-0.33) below the signal line (-0.23). This indicates softening momentum. However, RSI14 at 51.85 remains neutral, suggesting the cooling is a pause rather than a confirmed reversal.
Disclaimer: This article is for informational purposes only and does not constitute financial advice, an investment recommendation, or a solicitation to buy or sell any financial instrument or cryptocurrency. The analysis provided is not indicative of future results. Investing in crypto assets and financial markets carries a high risk of capital loss. Always do your own research (DYOR) and consult a qualified financial advisor before making any decision.
Article produced with the assistance of artificial intelligence and reviewed by the editorial team.
