




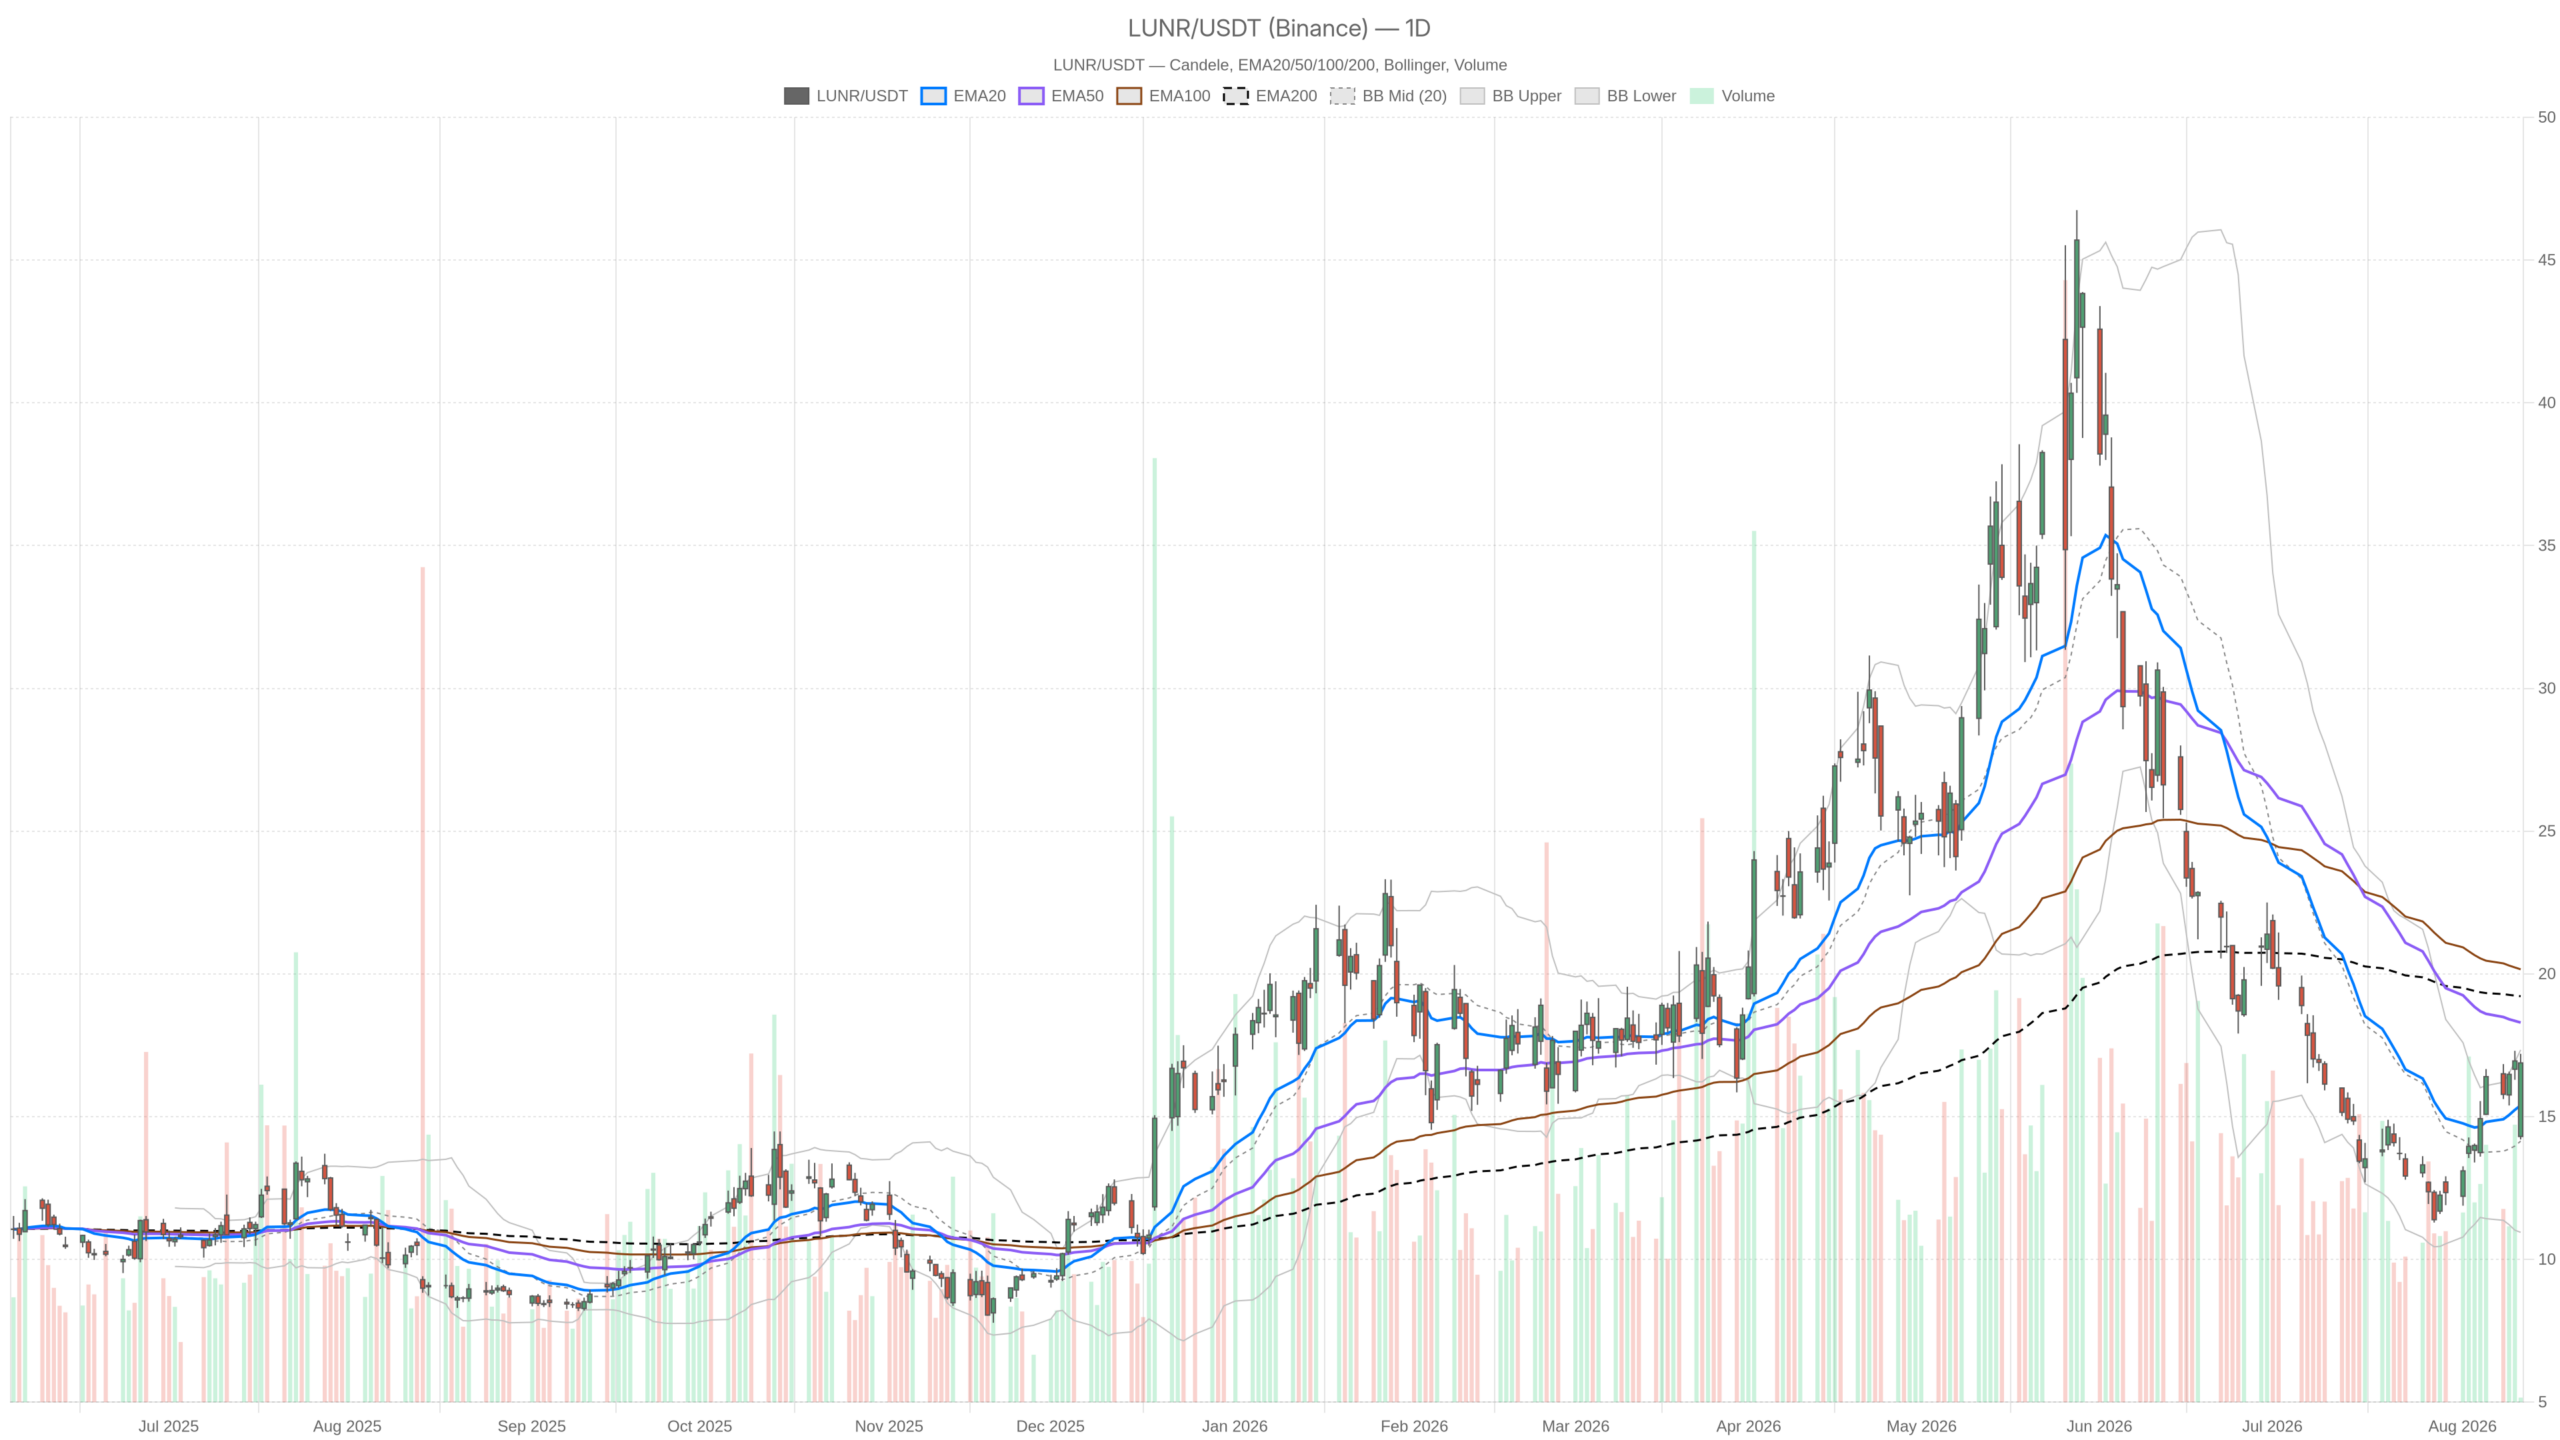
Intuitive Machines, Inc. stock is staging a sharp rebound this week, with LUNR closing at $16.88 after opening at $14.30. The session swept through a wide $14.20–$17.20 range on volume of 209,151 shares. That kind of print forces traders to reassess where the stock actually stands after a brutal multi-month decline.
Summary
Key takeaways
- LUNR closed at $16.88, rebounding sharply from a $14.30 open and pushing above its 20-day EMA at $15.39.
- The stock remains below the 50-day EMA at $18.30 and 200-day EMA at $19.22, keeping the broader trend structurally bearish.
- Daily RSI14 reads 54.71 (neutral), while the MACD histogram has turned positive at 0.87, signaling fading downside momentum.
- Hourly charts show a short-term bullish stack, but momentum is stalling precisely at the $16.91–$17.03 pivot resistance cluster.
- Earnings looms as a binary catalyst, with sentiment deeply divided after the stock’s 65% decline from recent highs.
Daily Structure: Strong Bounce, but the Trend Above Remains Heavy
On the daily timeframe, Intuitive Machines, Inc. stock sits above its 20-day EMA at $15.39. This reflects the strength of the recent rebound. However, the picture changes further out. The 50-day EMA at $18.30 and the 200-day EMA at $19.22 both remain well above spot. In short, LUNR is still underneath its medium- and long-term averages. That keeps the broader trend tilted bearish even as short-term price action turns aggressively higher.
The daily pivot structure adds useful context. Price is trading above the pivot point of $16.09. Resistance lands at R1 near $17.99 and support at S1 around $14.99. LUNR pushed straight through the pivot and is now testing the upper half of that range. Buyers have clearly regained control after the recent selloff. Still, the more meaningful $17.99 level remains untested.
Momentum and MACD: A Market Still Arguing With Itself
Daily RSI14 reads 54.71, a neutral reading that leaves room to move in either direction. It flags neither overbought nor oversold extremes. Meanwhile, the daily MACD line at -0.54 remains below its signal line at -1.41. That is technically still bearish territory. Notably, the histogram has turned positive at 0.87. This signals that downside momentum is fading and a potential shift is building beneath the surface. The core tension is clear: trend indicators still lean bearish, but momentum is improving.
Daily Bollinger Bands reinforce that improvement. The mid-band sits at $14.14, the upper band at $17.34, and the lower band at $10.95. With price near $16.88, LUNR is pressing close to the upper band. That signals real strength in the current leg. At the same time, a move this fast toward the upper band can mean the rally is getting stretched and vulnerable to a pause.
Daily ATR14 stands at $1.33, confirming that volatility has expanded meaningfully. For a stock trading in the mid-teens, that is a sizable range. It underscores how emotional this tape has become around the recent price swings.
1H Timeframe: Short-Term Bulls Are in Control, For Now
Zooming into the 1-hour chart, the picture leans more constructive for Intuitive Machines, Inc. stock. Price at $16.88 sits above the 20 EMA ($16.55), the 50 EMA ($15.64), and the 200 EMA ($16.02). That stacked alignment is a textbook short-term bullish setup. It confirms the daily rebound rather than contradicting it. On the other hand, hourly RSI14 at 65.05 is pushing toward overbought territory. The move is getting a little hot and could pause near current levels.
The hourly MACD adds a note of caution. The line sits at 0.44 versus a signal of 0.47. The histogram has slipped slightly negative at -0.03. This is a subtle but real signal that upward momentum on this timeframe is losing steam right near resistance. Combined with the hourly pivot at $16.91, R1 at $17.03, and S1 at $16.76, LUNR is essentially parked at a decision point. It trades right around the pivot with very little room before hitting either resistance or support.
Hourly Bollinger Bands show a mid-line of $16.47 and an upper band of $17.51. Price sits comfortably in the upper half of that range. Overall, the 1H timeframe confirms the daily bias to the upside. However, it adds a layer of complication: momentum is stalling exactly where resistance clusters.
15-Minute View: Execution Context Near a Tight Range
On the 15-minute chart, price is consolidating just under its own short-term averages. The 20 EMA sits at $16.93 and the 50 EMA at $16.72. RSI14 here reads a neutral 49.44. MACD is essentially flat with the histogram at -0.03. Bollinger Bands are notably tight. The mid-band rests at $16.98 and the upper band at just $17.16. This reflects the recent compression in intraday volatility.
This tight 15-minute range is capped by the same pivot resistance zone seen on the hourly chart ($16.91–$17.03). It is consistent with a market pausing to digest the prior surge before deciding its next move. For traders focused on entries, this level is the immediate battleground.
Bullish Scenario: Breakout Confirmation and Follow-Through
The bullish case for LUNR stock hinges on a clean break above the hourly and 15-minute resistance cluster near $17.03. It would then need a daily close above the $17.99 pivot resistance (R1). If that happens alongside sustained MACD histogram improvement on the daily chart, it would support the idea that the recent 65% correction has found a genuine floor. RSI holding above 50 without becoming overextended would add weight. A move back through the daily 20 EMA and toward the 50 EMA at $18.30 would strengthen that narrative considerably.
Bearish Scenario: Resistance Holds, Trend Reasserts Itself
The bearish case is just as straightforward. If LUNR fails to clear the $16.91–$17.03 pivot zone and the hourly MACD histogram continues drifting negative, the rebound risks stalling exactly where it currently sits. A slip back below the daily pivot at $16.09 would raise alarms. A break below S1 at $14.99 would invalidate the bullish attempt outright. That would put the stock back on track toward its heavier 50- and 200-day EMAs overhead near $18.30 and $19.22. In a bearish context, those levels would instead act as a reminder of how far price still needs to travel to repair the broader trend structure. The stock remains below both long-term averages, so any renewed weakness would confirm that the dominant trend has not yet turned.
Earnings Risk Adds Another Layer
The technical tug-of-war is playing out against a backdrop of real event risk for Intuitive Machines, Inc. stock. Coverage ahead of the company’s Q2 earnings has been mixed. One report points to surging sales estimates and strong space demand alongside execution risks. Another flags that LUNR does not currently have the right combination of factors typically associated with an earnings beat and may report negative earnings. Separately, a Seeking Alpha piece framed the stock’s decline of over 65% from recent highs as a potentially compelling entry point. Together, these pieces highlight just how divided sentiment is right now. Earnings will likely be the catalyst that resolves the current technical standoff one way or the other.
FAQ
Where is LUNR stock’s nearest resistance?
The nearest resistance sits at the hourly and 15-minute pivot zone between $16.91 and $17.03. Beyond that, the daily R1 resistance at $17.99 is the more significant level to watch for breakout confirmation.
Is LUNR still in a downtrend on the daily chart?
Yes. Despite the sharp rebound, LUNR remains below both its 50-day EMA ($18.30) and 200-day EMA ($19.22). Until price reclaims those levels, the broader daily trend structure remains bearish.
What does the MACD histogram turning positive signal?
The daily MACD histogram turning positive at 0.87 signals that downside momentum is fading. While the MACD line itself remains below the signal line (still bearish), the histogram shift suggests a potential momentum reversal is building beneath the surface.
How is earnings affecting the LUNR setup?
Earnings adds significant binary risk. Sentiment is deeply divided: some reports highlight surging sales estimates, while others flag that LUNR lacks the typical ingredients for a beat and may report negative earnings. The stock has already declined over 65% from recent highs, and the report will likely resolve the current technical standoff.
Disclaimer: This article is for informational purposes only and does not constitute financial advice, an investment recommendation, or a solicitation to buy or sell any financial instrument or cryptocurrency. The analysis provided is not indicative of future results. Investing in crypto assets and financial markets carries a high risk of capital loss. Always do your own research (DYOR) and consult a qualified financial advisor before making any decision.
Article produced with the assistance of artificial intelligence and reviewed by the editorial team.
