



Arm Holdings stock closed at $266.33 on July 27, down roughly 28% in a single month and deep inside bearish territory. With first-quarter fiscal 2027 earnings due July 29, the stock faces a critical technical crossroads ahead of a high-stakes binary event.
Summary
Key takeaways
- Arm Holdings stock has shed roughly 28% in a single month, closing at $266.33 on July 27.
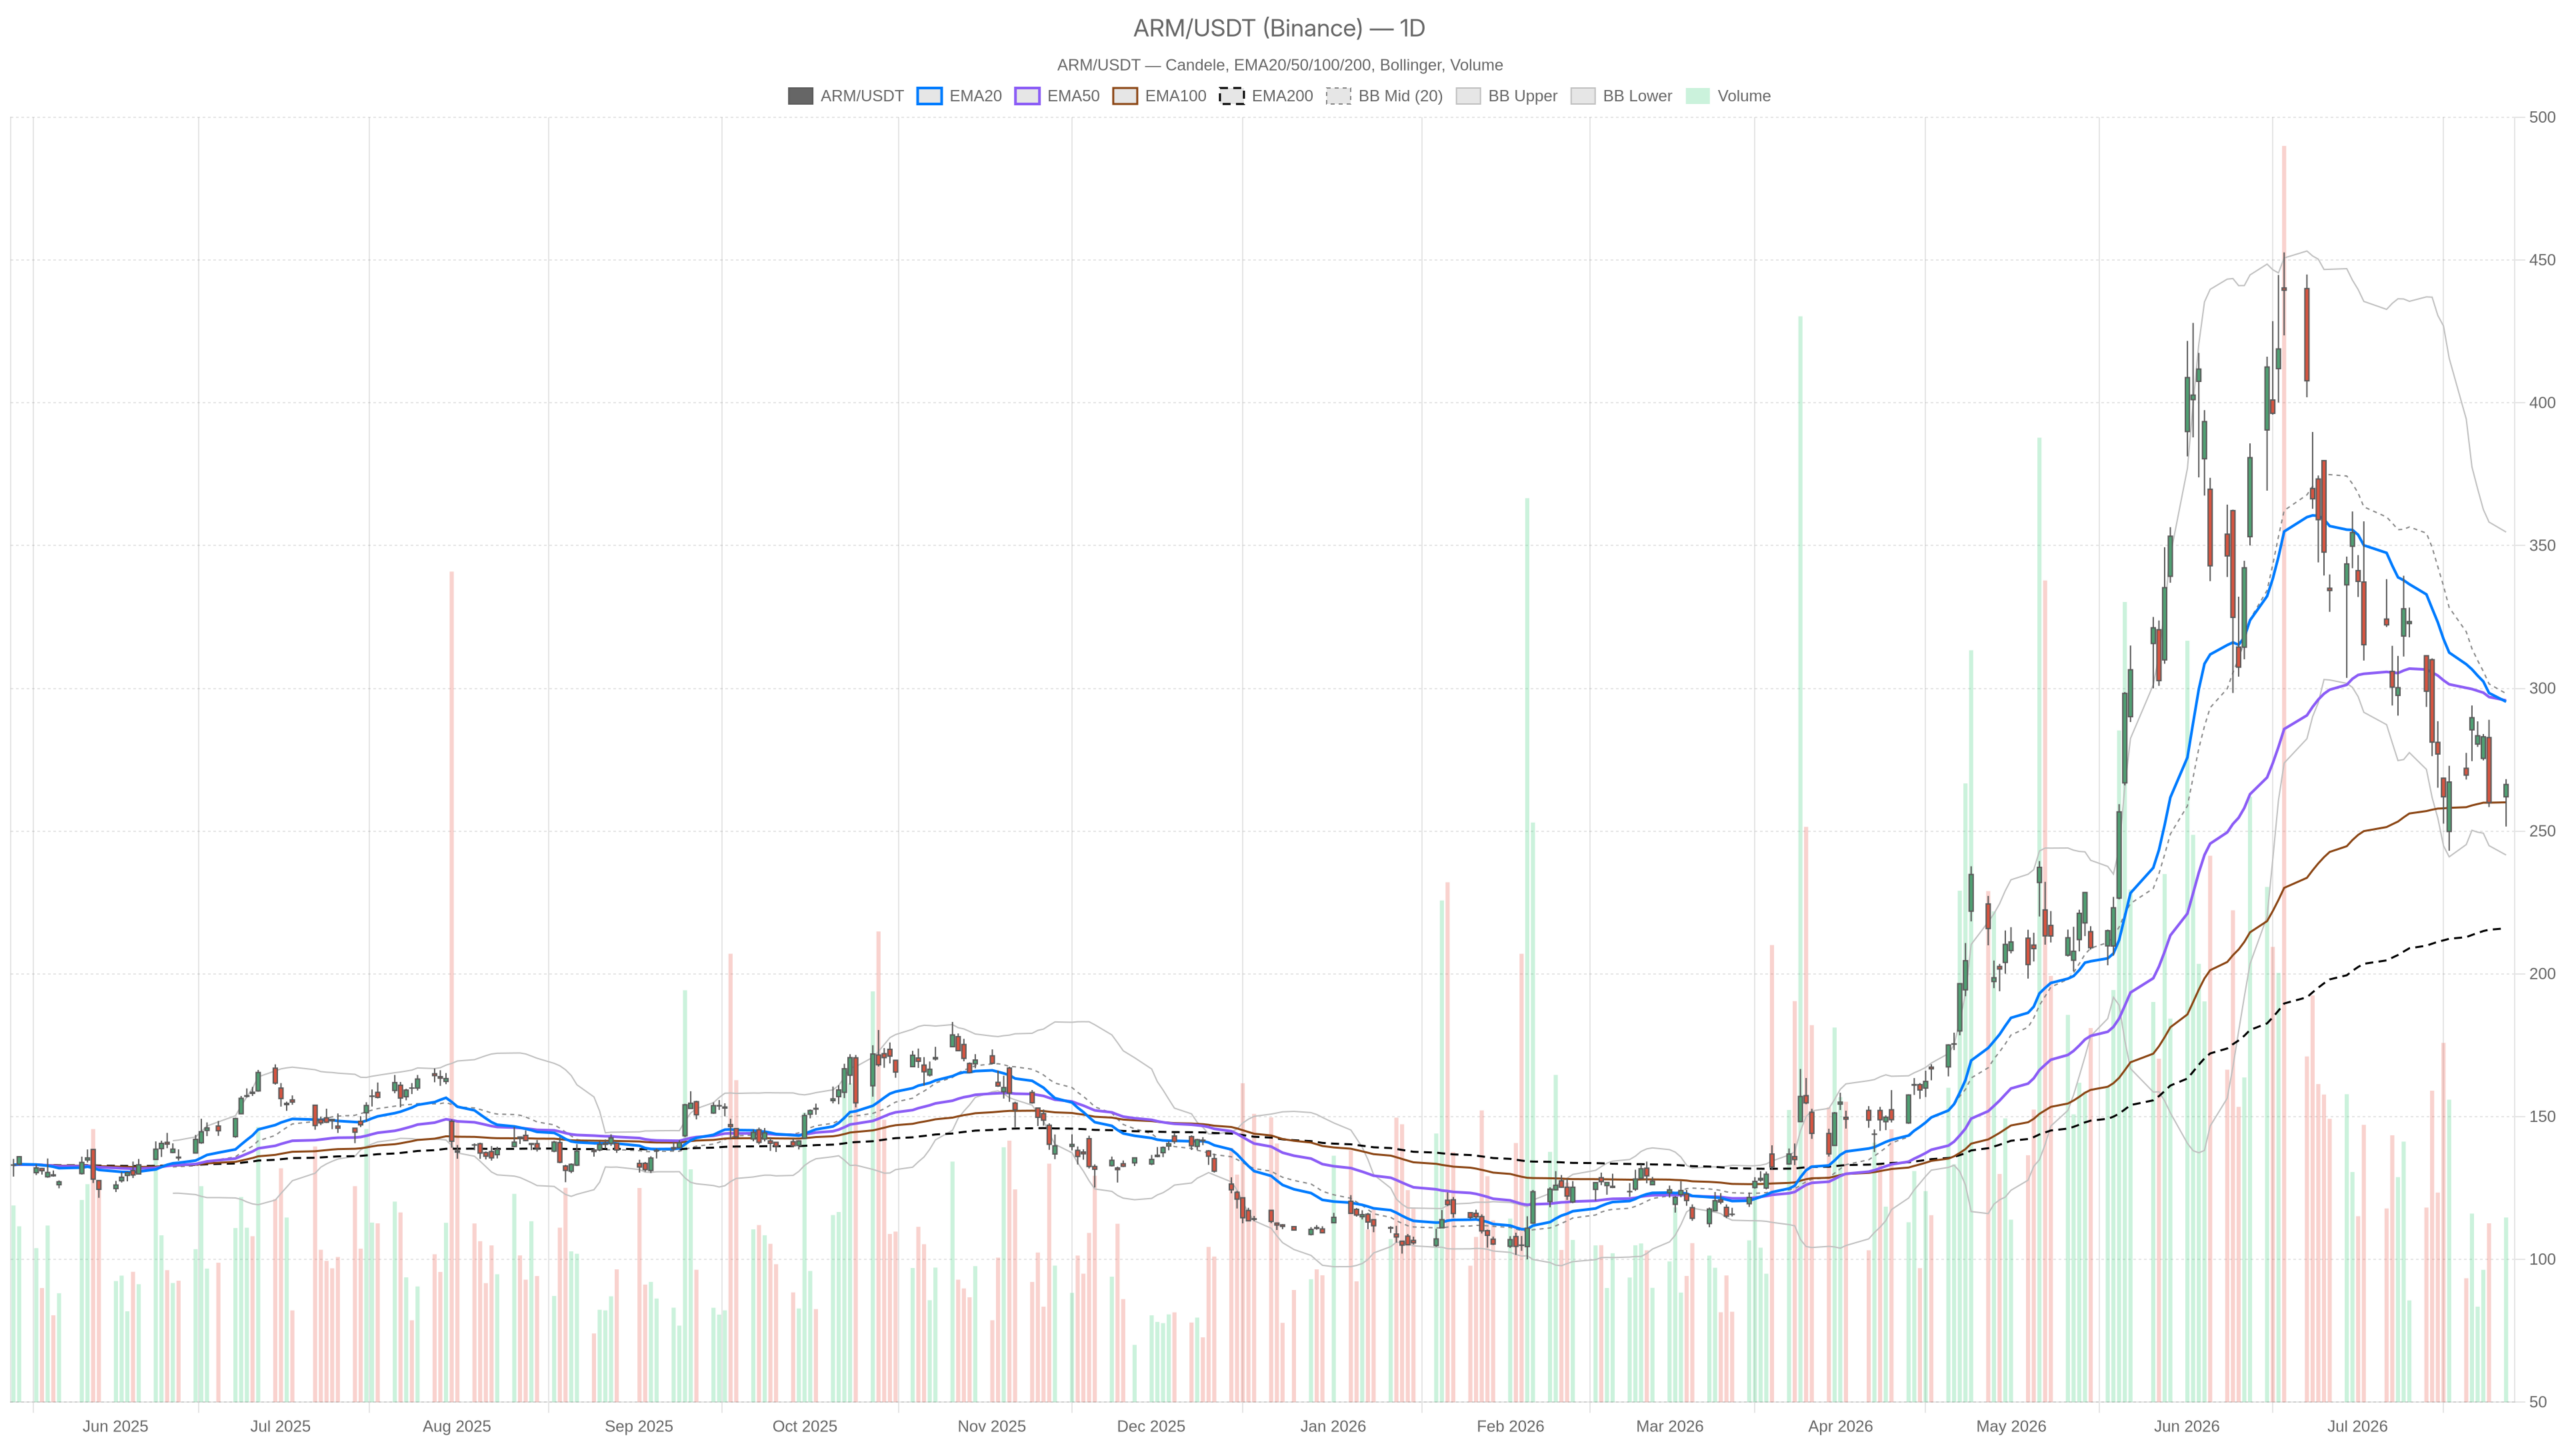
- The daily EMA20 and EMA50 cluster near $295.32–$295.78 — roughly $30 above current price — confirming the trend is broken.
- RSI14 at 40.28 on the daily chart has not reached oversold territory, leaving room for further downside.
- MACD momentum is accelerating downward; the histogram prints at -3.42 with no bullish crossover in sight.
- Q1 fiscal 2027 earnings on July 29 represent a high-impact binary catalyst; daily ATR14 stands at $22.38.
Daily Timeframe: Arm Holdings Stock Trend Is Broken
The daily chart confirms a broken trend. Momentum is not just negative — it is accelerating to the downside with no exhaustion signal in sight.
ARM’s EMA20 and EMA50 sit almost identically at $295.32 and $295.78. Both rest roughly $30 above the current price of $266.33. This cluster marks a prior support zone that has flipped to resistance. Meanwhile, the EMA200 remains far below at $215.96. It provides a long-term floor but offers no short-term comfort.
Notably, the RSI14 at 40.28 has not yet reached oversold territory. There is still room for further downside before any exhaustion-driven bounce materializes. The MACD reinforces this view. The MACD line sits at -17.28, well below a signal of -13.86. The histogram prints at -3.42. Momentum is negative and still accelerating on the daily chart.
Bollinger Bands place the midline at $298.18. This confirms the current price sits in the lower half of the daily range. The lower band at $241.62 defines the next meaningful technical floor. With an ATR14 of $22.38, daily swings of that magnitude are entirely normal for this stock. The daily regime is officially neutral, but the weight of evidence tilts bearish.
Pivot Levels: Sellers Defend a Tight Range
In terms of pivot structure, the daily levels reveal a tightly contested range. Sellers are defending the upper boundary with notable discipline.
The daily pivot sits at $262.05. R1 resistance stands at $272.48, while S1 support rests at $255.89. On July 27, ARM briefly tagged R1 intraday with a high of $268.20. It then pulled back to close at $266.33. That failure to hold above R1 on elevated volume is a subtle but meaningful signal. Buyers are present, but not dominant. Sellers are defending the upper end of the range with discipline.
Hourly Confirmation: Bearish Regime With a Fragile Signal
The hourly chart confirms a bearish regime. However, one fragile signal suggests selling pressure may be losing some momentum.
Stepping down to the 1H chart, the picture is explicitly bearish. The regime is flagged as bearish, and the moving average structure confirms it. Price at $266.47 is essentially pinned to the EMA20 at $267.33. Meanwhile, the EMA50 at $274.60 and EMA200 at $306.87 both loom overhead. They form cascading resistance levels. There is no clean bullish alignment anywhere on this timeframe.
However, there is one flickering signal worth noting. The hourly MACD histogram prints at +0.09 — barely positive, but positive nonetheless. The MACD line at -4.79 remains below the signal line at -4.87. Yet the gap has nearly closed. This hints that sharp selling pressure from previous sessions may be losing momentum. It is not a reversal signal. It is a pause signal — and a fragile one at that.
Meanwhile, the 1H RSI at 46.23 is neutral-to-weak. It neither signals an oversold bounce nor confirms fresh selling pressure. In context, this reading suggests ARM is in a holding pattern ahead of Wednesday’s catalyst. The hourly Bollinger midline at $268.60 aligns tightly with current price. This reinforces the idea that the stock is coiling rather than trending in the near term.
15-Minute Context: A Short-Term Pulse of Demand
The 15-minute chart offers the most constructive short-term signal in the stack. Its relevance, however, is limited to intraday execution context only.
The RSI14 on this timeframe prints at 61.02, pushing toward overbought territory on an intraday basis. The MACD histogram is at +1.30 with a positive line crossing above signal. The regime is classified as neutral. Price at $266.47 trades above both the EMA20 at $262.09 and EMA50 at $264.56. This suggests short-term momentum has shifted modestly in favor of buyers.
In isolation, this could tempt intraday traders. In context, it simply means ARM found some buying interest during the afternoon session of July 27. The broader structural damage on daily and hourly charts has not been repaired. This 15-minute strength is best read as a pre-earnings positioning move — not a meaningful trend shift.
The Bullish Case for Arm Holdings Stock
The bullish thesis rests on two pillars: a sharp monthly selloff that may have overshot fundamentals, and a structurally compelling business model in AI servers.
First, the stock has reportedly shed roughly 28% in a single month. Some analysts argue it could be as much as 40% undervalued heading into earnings. If that assessment holds water, the fundamental case for a sharp recovery is real. Second, Arm’s business model remains structurally compelling. Arm now leads x86 in AI servers and collects royalties from every chipmaker, including competitors. That kind of market positioning does not erode in a month.
For the bullish scenario to materialize technically, ARM needs to clear $272.48 — the daily R1 — and hold it. A strong earnings beat on July 29, paired with upward guidance revision, could fuel a rapid move back toward the $295 EMA cluster. That zone would be the first real test of whether the monthly downtrend is over or merely pausing.
The Bearish Scenario: Structural Weakness and a Clear Downside Target
The bearish case is straightforward. Earnings disappointments in this market environment punish overvalued tech names hard — and ARM enters earnings already technically broken.
ARM entered earnings season already trading below its primary moving averages. A miss or a cautious forward outlook could push the stock toward the daily Bollinger lower band at $241.62. That level sits roughly 9% below the July 27 close. Given the ATR14 of $22.38, such a move could unfold within two to three sessions.
Moreover, the daily MACD remains in deep negative territory. There is no sign of a bullish crossover forming. The overall weight of technical evidence argues that sellers remain structurally in control. EMA alignment, MACD momentum, and the failed reclaim of R1 intraday all point in the same direction. Any earnings pop that fails to clear and hold $295 would likely be faded aggressively.
Positioning Into a High-Volatility Event
Arm Holdings stock enters earnings as a technically damaged name facing a high-impact binary event. The burden of proof lies entirely with the bulls.
The daily chart carries the clearest message. The trend is broken, momentum is negative, and no technical floor has been confirmed. The hourly chart offers just enough stabilization to prevent this from looking like a capitulation. However, it is not enough to justify outright bullish positioning based on technicals alone.
With an ATR of $22.38 on the daily frame and earnings due July 29, the implied volatility environment is unforgiving. Traders should account for the possibility of a move well beyond normal daily ranges in either direction. The AI server narrative and the undervaluation argument are real. But narratives do not override price structure until price confirms them. Until ARM reclaims its key moving averages with conviction, uncertainty remains the dominant theme.
FAQ
What is the technical outlook for Arm Holdings stock ahead of earnings?
The technical picture is firmly bearish. ARM closed at $266.33 on July 27, well below its EMA20 and EMA50 near $295. The RSI14 sits at 40.28 with room for further downside, and MACD momentum continues to accelerate lower. The daily trend is confirmed broken, and the burden of proof rests on the bulls.
What are the key price levels to watch for ARM?
Key resistance sits at $272.48 (daily R1), followed by the critical EMA cluster near $295. Key support rests at $255.89 (daily S1), with the Bollinger lower band at $241.62 defining the next major technical floor — roughly 9% below the July 27 close.
Why is the July 29 earnings report important for Arm Holdings stock?
The Q1 fiscal 2027 earnings report is a high-impact binary event. With a daily ATR14 of $22.38, ARM could move well beyond normal daily ranges in either direction. The report will either validate the bullish undervaluation thesis or confirm the bearish technical breakdown already visible on the charts.
Is Arm Holdings stock undervalued heading into earnings?
Some analysts argue ARM could be as much as 40% undervalued following the 28% monthly decline. The company’s leadership in AI servers and royalty-based business model remain structurally compelling. However, price structure has not yet confirmed this fundamental thesis, and technical momentum remains negative.
Disclaimer: This article is for informational purposes only and does not constitute financial advice, an investment recommendation, or a solicitation to buy or sell any financial instrument or cryptocurrency. The analysis provided is not indicative of future results. Investing in crypto assets and financial markets carries a high risk of capital loss. Always do your own research (DYOR) and consult a qualified financial advisor before making any decision.
Article produced with the assistance of artificial intelligence and reviewed by the editorial team.
