




Applied Digital stock faces a defining moment. APLD closed at $26.38 on July 27, well below every major moving average. Yet Q4 FY2026 results triggered a 3% overnight bounce after the bell. Strong forward guidance now collides with a weakened technical structure.
Summary
Key takeaways
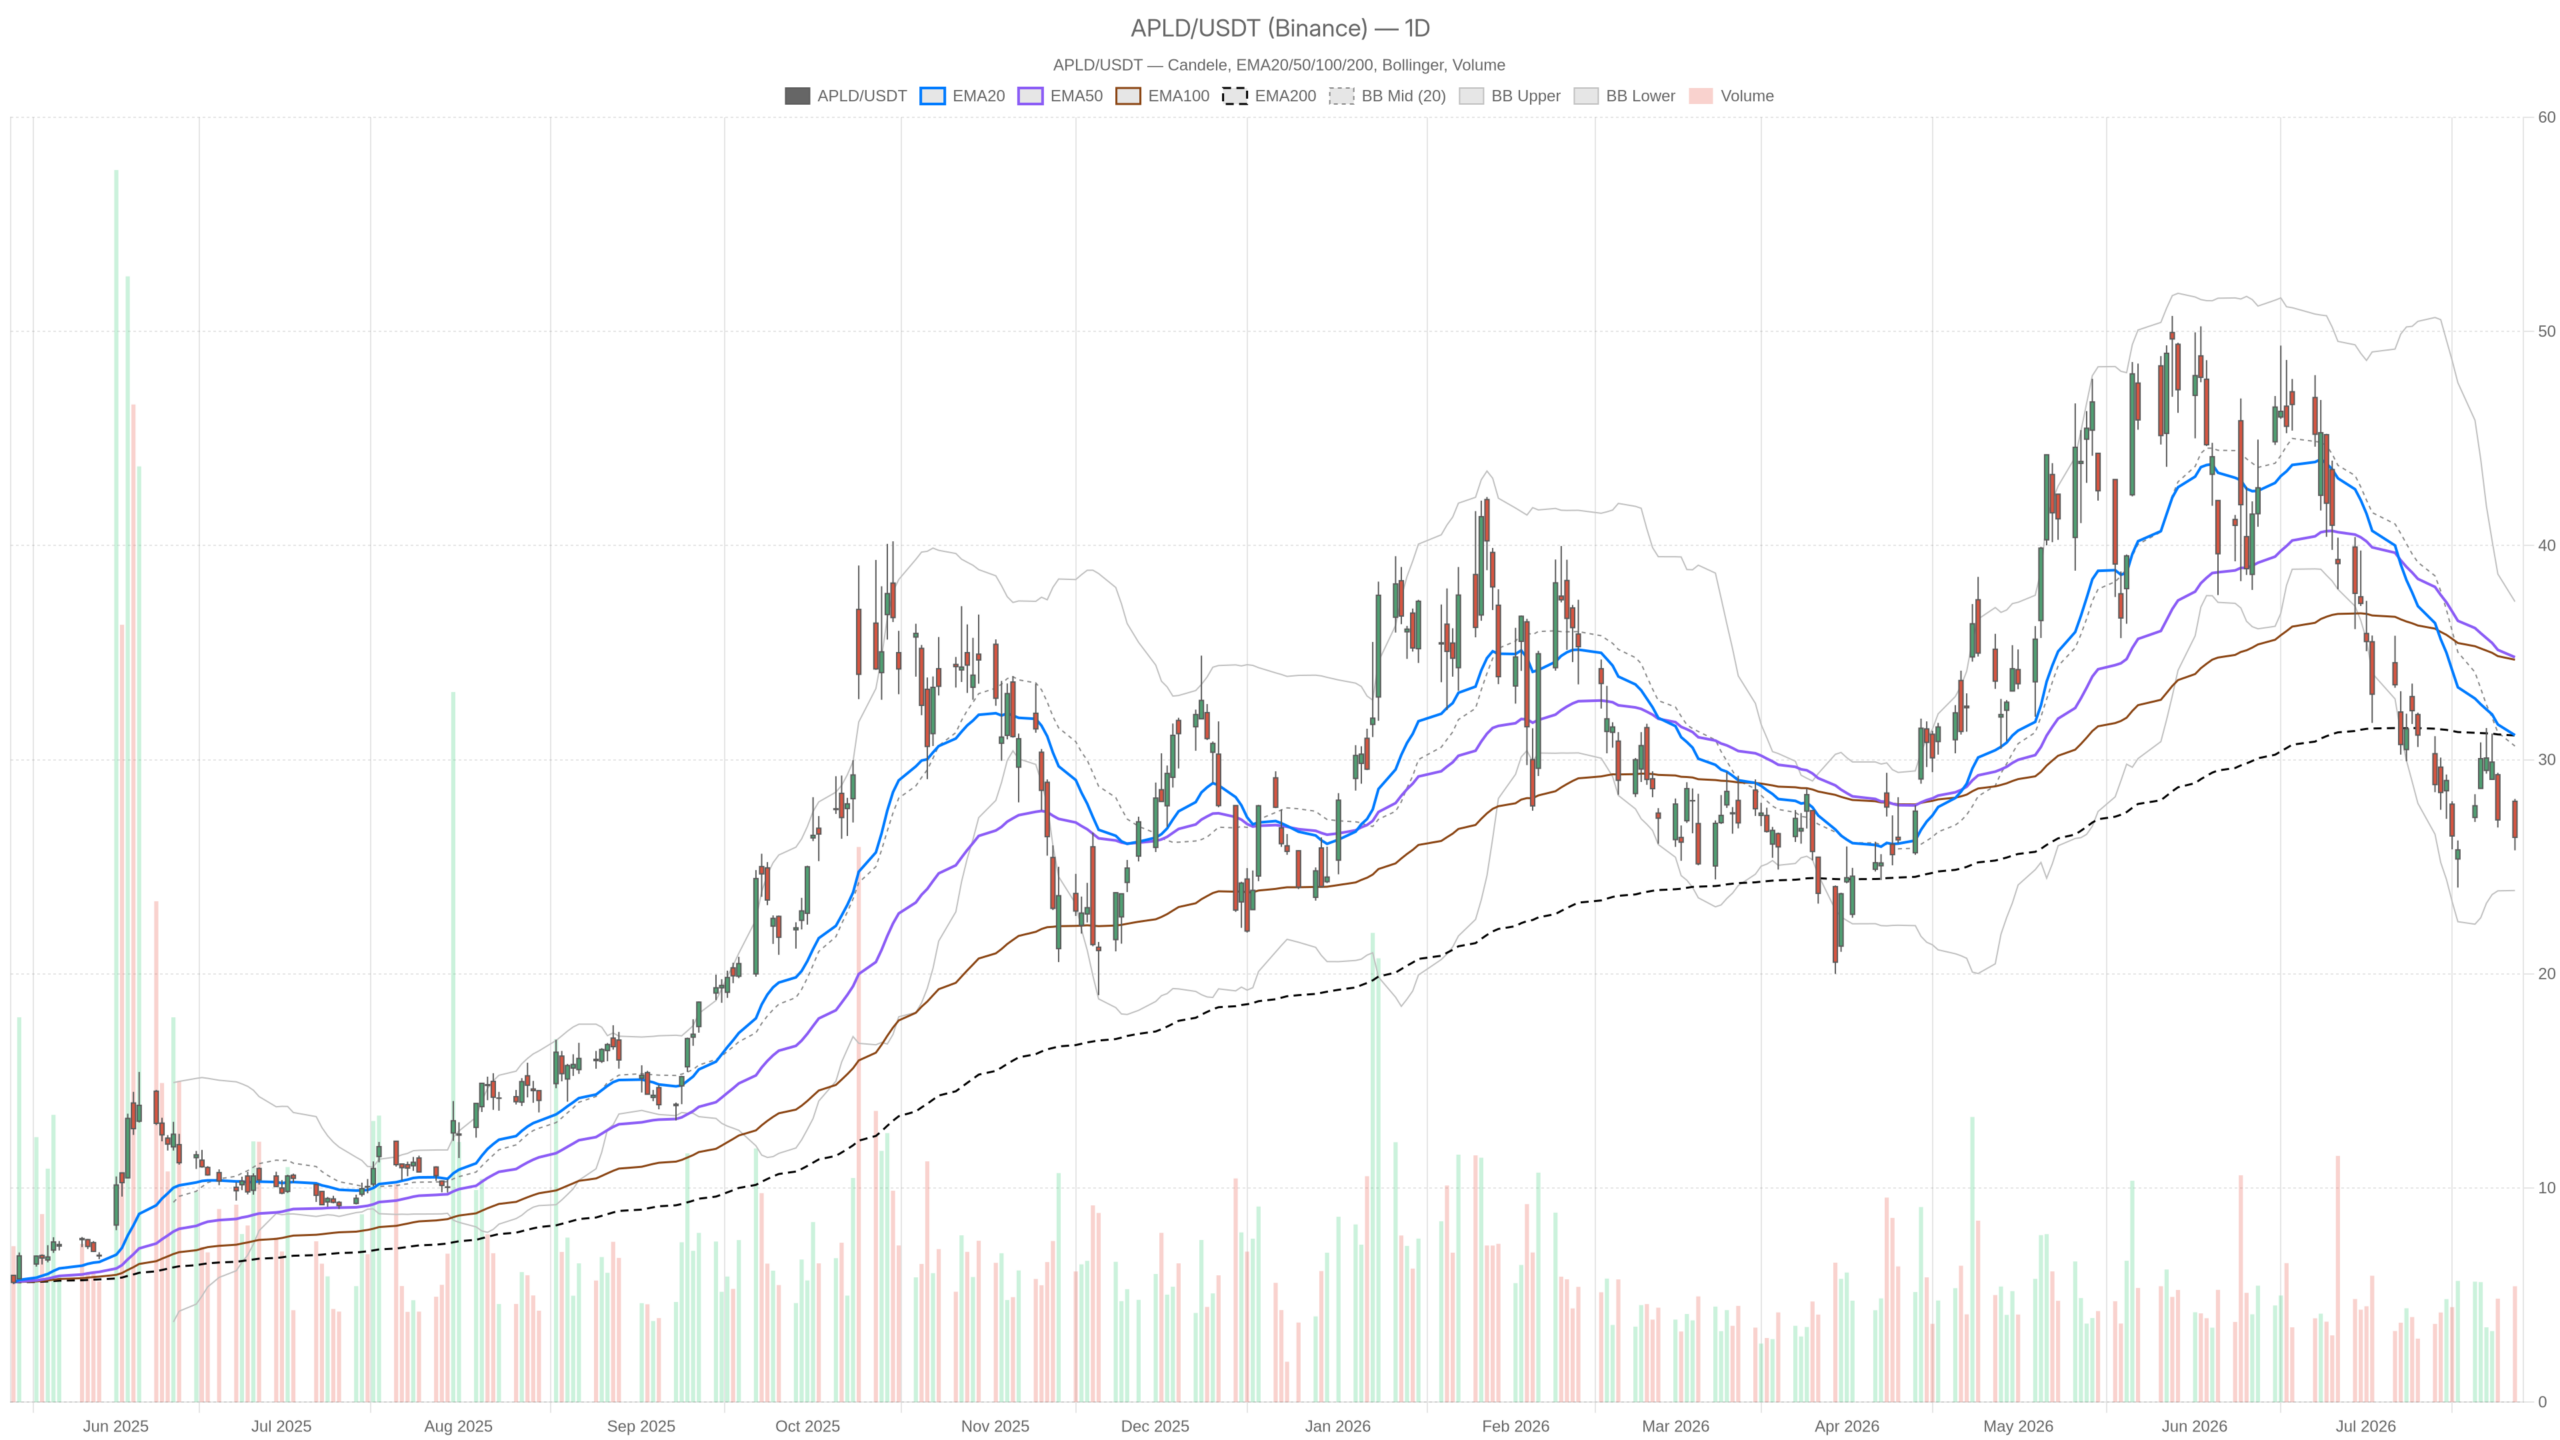
- APLD closed at $26.38 on July 27, below its EMA20 ($31.15), EMA50 ($34.79), and EMA200 ($31.13).
- Applied Digital reported $258.7 million in Q4 FY2026 revenue and $36 billion in contracted lease value.
- Management guided for a $1 billion net operating income run rate within one year, with 1.41 gigawatts of AI campus capacity under development.
- The daily RSI sits at 33.2, approaching oversold, while the MACD histogram turned marginally positive at +0.06.
- A sustained reclaim of the daily pivot at $26.77 is needed to neutralize the near-term bearish bias.
Daily Bias: Applied Digital Stock Remains Under Bearish Control
APLD’s daily chart is unequivocally bearish. Price sits below all three key moving averages in a descending stack.
The daily timeframe leaves little room for ambiguity. At $26.38, APLD trades below its EMA20 at $31.15, its EMA50 at $34.79, and its EMA200 at $31.13. All three averages are stacked in bearish order. Price is not close to reclaiming any of them. That separation from dynamic resistance signals sustained selling pressure, not a routine pullback.
The daily RSI at 33.2 is approaching oversold territory. However, an RSI drifting toward 30 in a structurally bearish trend is less a buy signal. It reflects persistent downward momentum instead. It becomes actionable only when paired with a credible reversal catalyst. The earnings release may be providing exactly that.
Meanwhile, the daily MACD line sits at -3.18 against a signal of -3.24. The histogram reads +0.06 — marginally positive for the first time in an extended bearish cycle. This is a very early signal. It does not confirm a reversal. But it suggests the pace of decline may be slowing.
Volatility Context and Pivot Levels
In addition, Bollinger Band positioning reinforces the cautious read. The daily midband stands at $30.64. The upper band is at $37.38 and the lower band at $23.89. Price sits in the lower half — consistent with bearish momentum. Still, it remains above the lower band, leaving room for further downside before any statistical extreme is reached.
At the same time, the daily ATR of $2.44 confirms a high-volatility environment. Swings of this magnitude are routine, and that matters for risk sizing. Daily pivot levels place the pivot at $26.77, with resistance at $27.77 and support at $25.37. The close at $26.38 is slightly below the pivot. That is a mild negative heading into the next session. A sustained reclaim of $26.77 would at least neutralize the near-term intraday picture.
Hourly Timeframe: Confirming the Downside, With Minor Relief
The hourly chart confirms the bearish thesis without exception. Price sits meaningfully below all three hourly moving averages.
The 1H chart does nothing to challenge the daily bearish picture. In fact, it reinforces it. The 1H EMA20 sits at $27.52, the EMA50 at $28.36, and the EMA200 at $33.37. At $26.38, APLD trades well below all three. The 1H regime is explicitly bearish.
On the hourly timeframe, the RSI reads 34.75 — also near oversold, mirroring the daily. The 1H MACD line is at -0.81 versus a signal of -0.63, with a histogram of -0.18. Unlike the daily, the hourly histogram remains negative and deteriorating. That divergence matters. The daily hints at a deceleration in selling; the hourly is not yet confirming it.
Hourly pivot levels are tight: pivot at $26.44, resistance at $26.66, support at $26.15. With the close at $26.38, APLD was hugging its hourly pivot as the session ended. Meanwhile, the overnight news flow will likely gap the stock above $26.66. That would be the first meaningful technical reclaim worth monitoring.
15-Minute Context: A Quiet Stabilization Before the Catalyst
The 15-minute chart shows a stabilization pattern, not a reversal. Micro-indicators turned neutral ahead of the earnings release.
The 15-minute chart offers a more nuanced short-term read. The 15m RSI is at 46.3 — neutral, not oversold. The 15m MACD histogram is actually positive at +0.10. This suggests the most recent micro-trend was mildly constructive heading into the close. The 15m regime is tagged bearish, but the indicators show clear stabilization.
Notably, the 15m Bollinger Bands are narrow: upper at $26.61, lower at $25.87, with a midband of $26.24. Price closed at $26.38 — essentially at the midband and close to the upper band. This tight compression after a volatile session often precedes an expansion move. The earnings news provides the fundamental trigger for that expansion.
The Fundamental Catalyst: $36B in Contracted Lease Value
Applied Digital’s Q4 FY2026 results revealed a $36 billion contracted lease pipeline. It dramatically exceeds what the current stock price reflects.
Applied Digital reported Q4 FY2026 revenue of $258.7 million for the period ended May 31, 2026. More striking than the quarterly figure is the forward pipeline. The company’s contracted lease value has reached $36 billion. It also has 1.41 gigawatts of AI campus capacity under development. Management guided for a $1 billion net operating income run rate within one year. CEO Wes Cummins noted that five new leases were signed during the quarter.
Still, for a company whose stock trades below every key daily moving average, numbers of this scale represent a genuine valuation disconnect — at least on the surface. The overnight 3% bounce reflects an initial market reassessment. Whether that reassessment gains traction in regular trading hours is the central question.
Bullish Scenario: Earnings Reclaim the Structure
The bullish case requires Applied Digital stock to reclaim the EMA20 at $31.15. That means an 18% rally from Monday’s close. It is ambitious but not impossible given the earnings catalyst.
The bull case rests on the earnings catalyst being powerful enough to shift the daily technical regime. For that to happen, APLD would need to close back above the EMA20 at $31.15 on a sustained basis. That demands roughly an 18% rally from Monday’s close. It requires follow-through buying, not just a gap-open reaction.
However, a more immediate bullish confirmation would be a daily close above the pivot at $26.77 and then resistance at $27.77. Reclaiming these levels would suggest Monday’s low at $25.77 may serve as a near-term floor. The daily MACD histogram turning positive adds a faint structural tailwind. Combined with an RSI approaching oversold levels, the setup for a short-term bounce is present. Price just needs to follow through.
Bearish Scenario: Guidance Fails to Offset Technical Damage
The bearish case is that months of technical damage outweigh even strong guidance. A gap-and-fade reaction would confirm sellers still control Applied Digital stock.
On the other hand, the bearish case is straightforward. The technical damage accumulated over recent months is significant. Price sits more than $5 below the EMA20 and nearly $8.50 below the EMA50. Even a well-received earnings report does not fix that overnight. A gap-and-fade reaction — where APLD opens higher but sellers use the strength to exit — would confirm the bears remain in control.
In that scenario, the critical level to watch is the Bollinger lower band at $23.89. A breakdown there would signal acceleration, not stabilization. The daily ATR of $2.44 means that kind of move could develop within a few sessions if sentiment sours. The hourly MACD remaining negative throughout the next session would be the early warning.
Positioning in a High-Volatility, High-Stakes Setup
Applied Digital stock now trades at a crossroads between a damaged chart and an ambitious growth narrative. Near-term volatility expansion is likely in both directions.
Applied Digital stock sits at the intersection of a technically damaged chart and a fundamentally ambitious growth narrative. The earnings release — $36 billion in contracted lease value, a $1 billion NOI target, 1.41 gigawatts of AI capacity — deserves serious attention. At the same time, the daily structure remains bearish by every objective measure. The move from $25.77 to a potential gap-up open does not repair months of technical deterioration overnight.
Overall, the near-term risk profile is elevated in both directions. Volatility expansion is likely given the earnings catalyst and the compressed Bollinger Band reading on the 15m chart. Traders and investors should focus on whether APLD can sustain gains above the daily pivot at $26.77. Ultimately, price must press toward the EMA20 at $31.15. Until that sequence plays out, the daily bias remains bearish — even with a compelling fundamental story developing underneath.
FAQ
What is the current technical outlook for Applied Digital stock?
Applied Digital stock is in a bearish daily structure. It closed at $26.38, below its EMA20 ($31.15), EMA50 ($34.79), and EMA200 ($31.13). The daily RSI at 33.2 is approaching oversold, while the MACD histogram has just turned marginally positive — an early but unconfirmed signal.
What were Applied Digital’s key Q4 FY2026 earnings figures?
Applied Digital reported Q4 FY2026 revenue of $258.7 million for the period ended May 31, 2026. The company disclosed $36 billion in contracted lease value and 1.41 gigawatts of AI campus capacity under development. Management guided for a $1 billion net operating income run rate within one year.
What price levels should traders watch on APLD?
The daily pivot at $26.77 is the immediate level to reclaim for near-term neutrality. Above that, resistance sits at $27.77. The EMA20 at $31.15 represents the key structural level bulls need to recapture. On the downside, the Bollinger lower band at $23.89 is the critical support to monitor.
Is Applied Digital stock a buy after its latest earnings report?
The earnings report is fundamentally compelling, with a $36 billion contracted lease pipeline and a $1 billion NOI target. However, the daily technical structure remains bearish. The overnight 3% bounce is an initial positive reaction, but sustained buying above $26.77 and eventually $31.15 is needed to shift the technical regime.
Disclaimer: This article is for informational purposes only and does not constitute financial advice, an investment recommendation, or a solicitation to buy or sell any financial instrument or cryptocurrency. The analysis provided is not indicative of future results. Investing in crypto assets and financial markets carries a high risk of capital loss. Always do your own research (DYOR) and consult a qualified financial advisor before making any decision.
Article produced with the assistance of artificial intelligence and reviewed by the editorial team.
