



GLW stock closed at $143.36 on July 27, deep below key moving averages with bearish momentum across timeframes. A Q2 earnings report due the following morning introduces a binary catalyst. The daily bias is bearish, confirmed by hourly structure, with only a modest tactical bounce visible on the 15-minute frame.
Summary
Key takeaways
- GLW stock trades at $143.36, well below the daily EMA20 ($171.63) and EMA50 ($178.76)
- The daily RSI at 35.44 approaches oversold but still has room to deteriorate further
- The EMA200 at $142.57 is the single most critical near-term support level
- Q2 earnings, with a consensus estimate of $0.76 per share, create a binary event amplified by a daily ATR of $12.17
- AI-related fiber demand and Optical Communications strength are the key fundamental tailwinds
Daily Structure: Bearish Trend Defines GLW Stock
Moving Averages Signal Deep Structural Damage
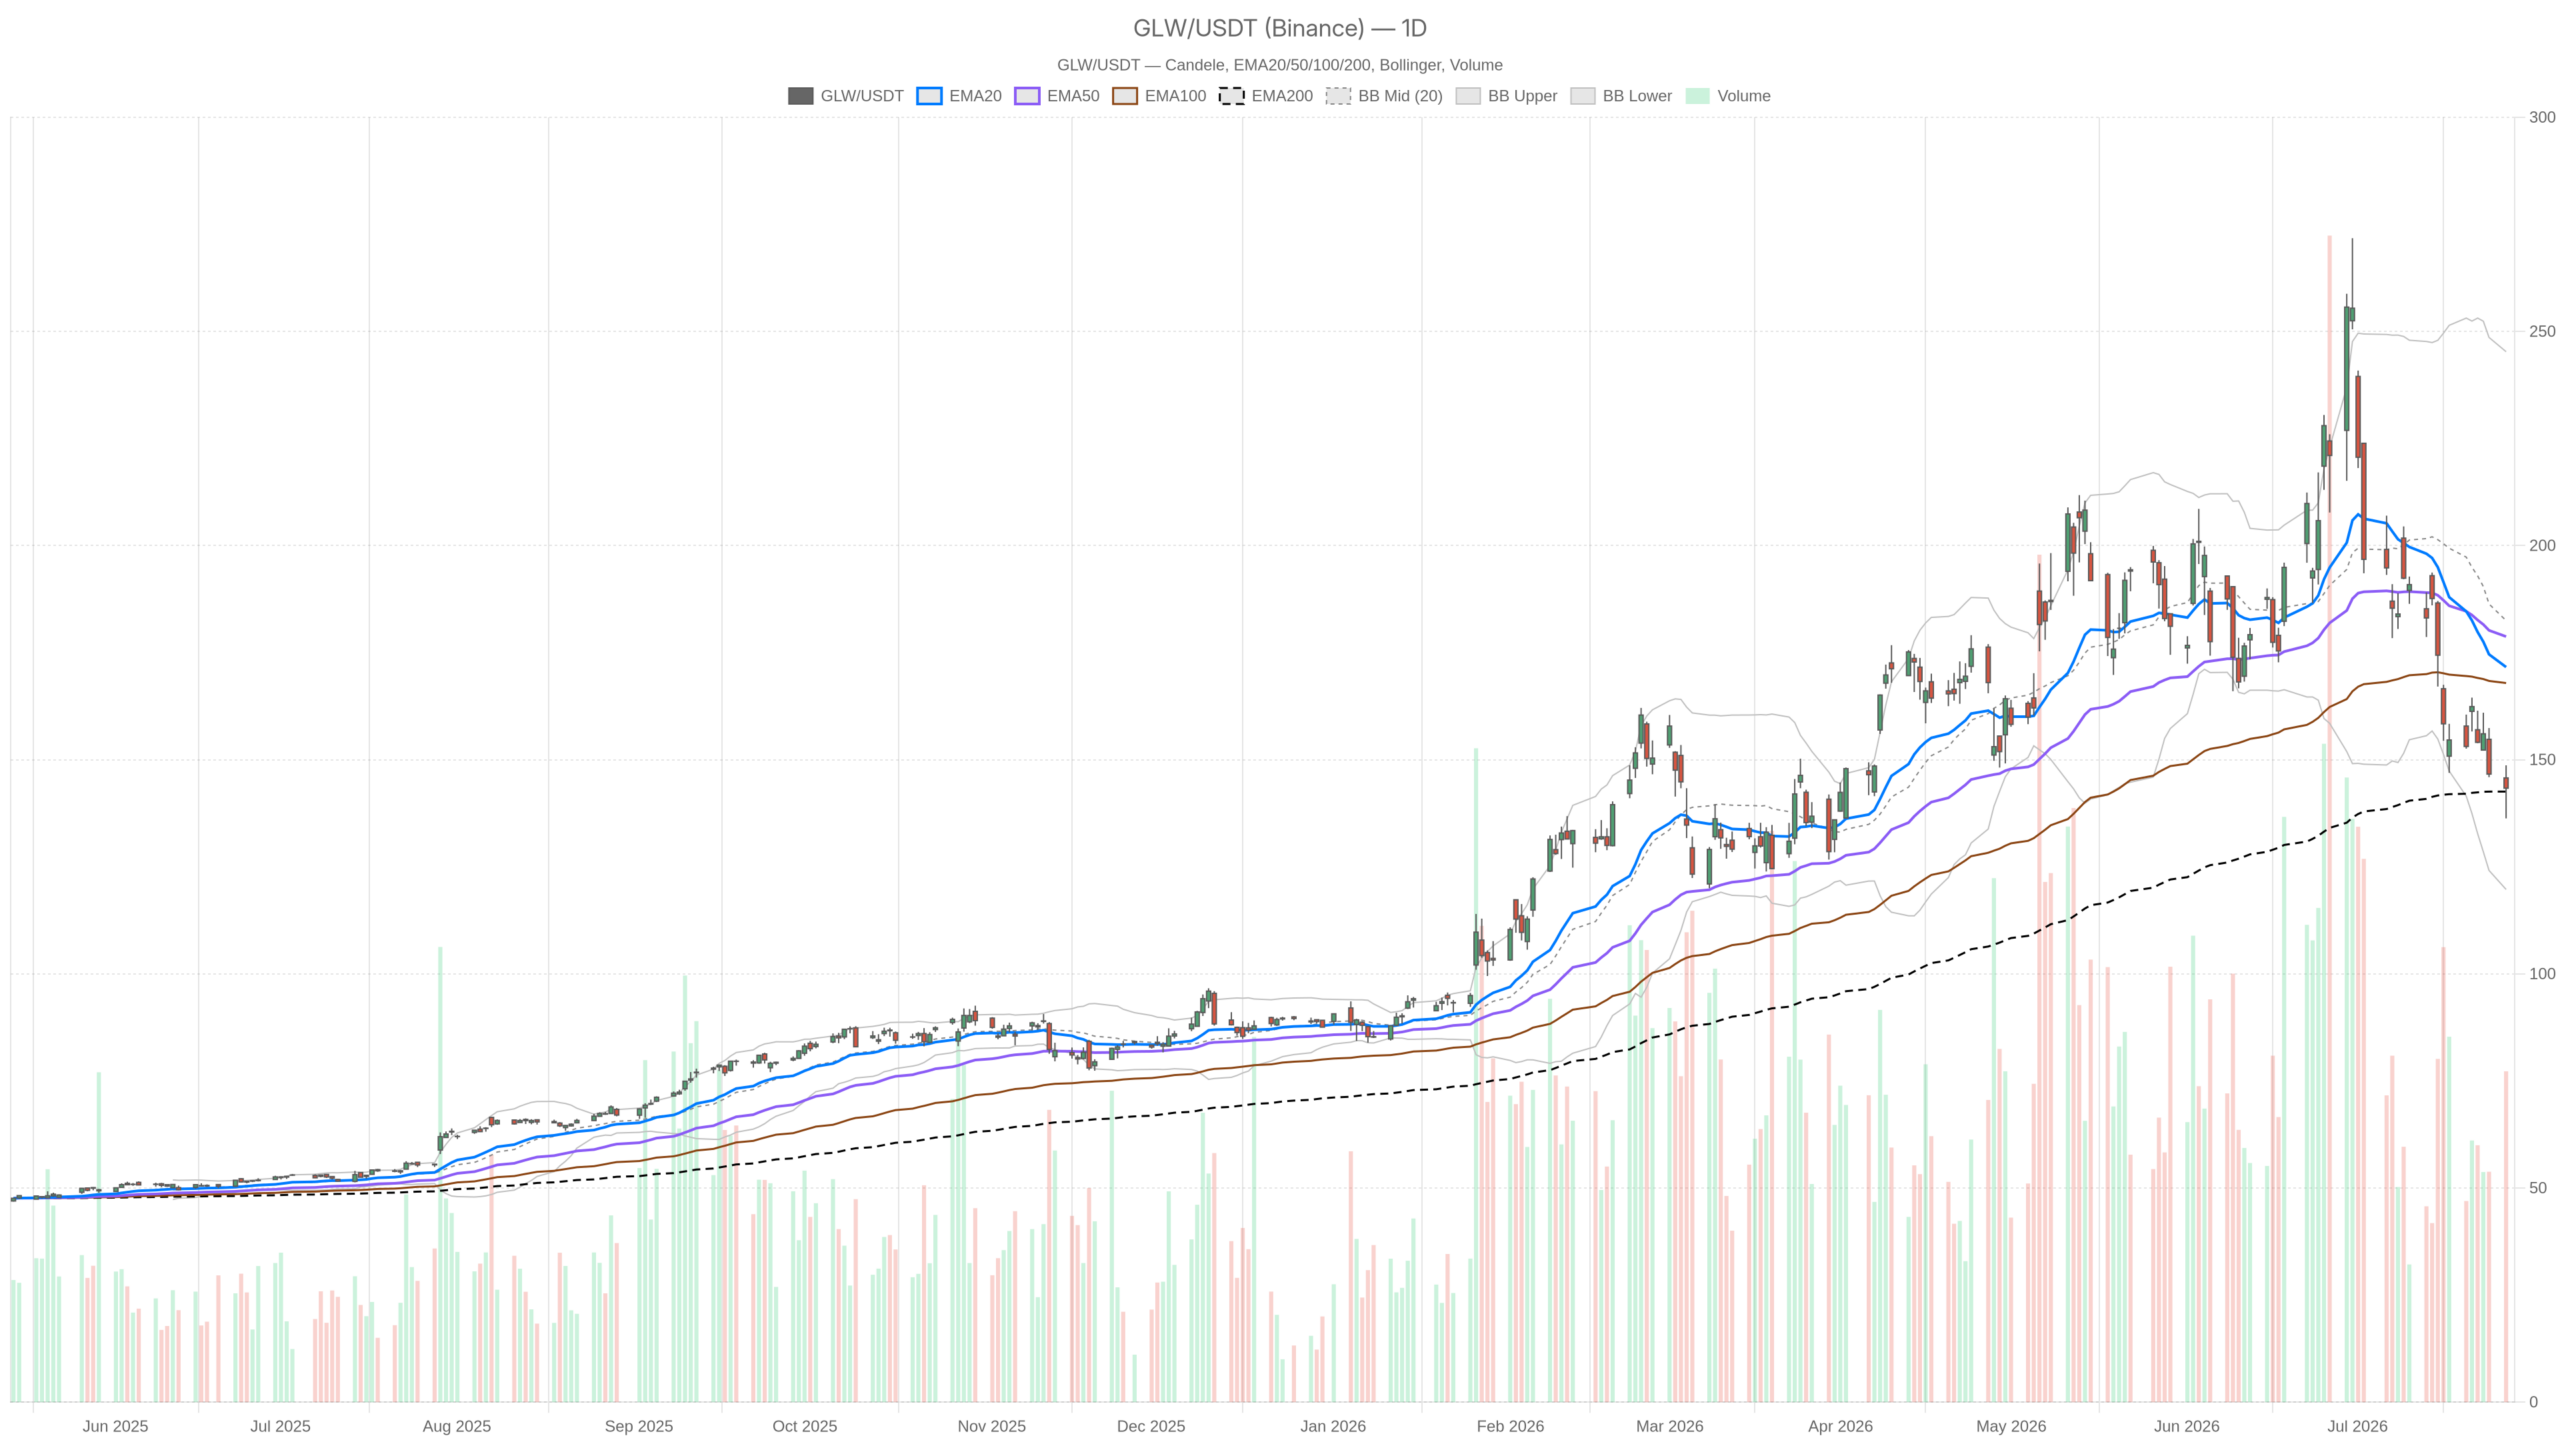
The D1 chart reveals sustained selling pressure. The EMA20 sits at $171.63 and the EMA50 at $178.76 — both well above the current price. That gap alone signals a protracted decline from much higher levels. GLW stock has not managed a meaningful recovery toward either average.
Meanwhile, the EMA200 at $142.57 is the one level working in the bulls’ favor. Price sits almost exactly on top of that long-term average. Historically, the 200-day EMA acts as a gravitational anchor for institutions reassessing longer-term value. Whether it holds as genuine support or merely delays further downside is the central question.
Momentum Indicators Confirm Accelerating Bearish Pressure
The daily RSI at 35.44 approaches oversold territory without quite reaching it. This is a cautionary reading. Oversold RSI readings near 30 can signal seller exhaustion — but at 35, there is still room to deteriorate further. The MACD reinforces the downside case: the line reads -12.82 against a signal of -8.36, producing a histogram of -4.46. The histogram is negative and widening, reflecting accelerating bearish momentum rather than a slowdown.
Bollinger Bands on the daily are extremely wide — upper at $245.27, lower at $119.71, midline at $182.49. The sheer width reflects elevated volatility. At $143.36, GLW stock trades well below the midline, indicating bears remain in control of the distribution range.
At the same time, the daily ATR stands at $12.17 — a wide swing range for a single session. On July 27, the intraday range stretched from $136.31 to $148.69, a $12.38 spread closely matching the ATR. This is an asset moving with conviction, not drifting. The daily pivot sits at $142.79, with R1 at $149.26 and S1 at $136.88. The close at $143.36 just above the pivot is marginally positive for near-term stability. Still, the overall daily regime is tagged as neutral — a softening from outright bearish, though insufficient to shift the thesis.
Hourly Confirmation: Bearish Regime Validates the Daily View
Meanwhile, the 1H timeframe adds important nuance. The hourly regime is explicitly labeled bearish — more decisive than the daily neutral reading. Price closed the last hourly bar at $143.30, sitting below the hourly EMA20 ($146.93) and well below the EMA50 ($155.05). The EMA200 on the hourly chart stands at $177.68, reinforcing the structural damage visible on the daily.
On the hourly, RSI reads 38.33 — similarly approaching oversold without triggering a reversal signal. The MACD line at -4.63 versus signal at -4.27 produces a histogram of -0.36. The histogram is slightly negative but flattening.
Notably, a flattening hourly MACD histogram after a sustained decline can sometimes precede a short-term relief move. This is especially relevant when price sits on a key structural level like the EMA200. However, it should not be mistaken for a bullish reversal signal.
The hourly Bollinger Bands show the midline at $148.50 and lower band at $134.50. Price trades in the lower half of the band, consistent with sustained bearish control. The hourly ATR at $3.57 confirms that intraday swings remain meaningful — well above typical low-volatility baseline readings.
15-Minute Execution: A Tactical Bounce Within a Bearish Structure
In contrast, the 15-minute frame offers a slightly different tone — relevant for short-term positioning but not enough to reverse the thesis. The regime is neutral at the intraday level. RSI on the 15m sits at 57.58, pointing to a moderate recovery from the day’s lows. The MACD histogram is positive at +0.80, with the line at -0.66 crossing above the signal at -1.46. That crossover signals near-term buying interest.
Price at $143.30 is above the 15-minute EMA20 ($141.28), adding tactical bullish momentum. However, it remains well below the 15m EMA50 ($144.48) and the EMA200 ($155.61). The intraday bounce is therefore a short-term event within a larger bearish context. Pivot levels mirror the hourly: PP at $142.84, R1 at $143.76, S1 at $142.38. GLW stock sits between the pivot and R1 — a narrow range with limited immediate upside before resistance is encountered.
The Earnings Wildcard: AI Fiber Demand Versus Macro Headwinds
Beyond the charts, Corning heads into Q2 results with a specific fundamental backdrop. Carillon Tower Advisers cited GLW as a beneficiary of growing AI-related fiber and optical demand in its Q2 2026 investor letter. Wall Street analysts raised their quarterly earnings estimate to $0.76 per share, driven by projected strength in Life Sciences and Optical Communications. Automotive faces softer demand, introducing some drag on the aggregate picture.
Notably, Corning’s cell culture business has also attracted analyst attention as a secondary growth narrative. This could quietly broaden the investment thesis beyond pure AI infrastructure exposure. The AI-driven optical business and solar growth have been cited as key supports for the company’s outlook heading into earnings.
In short, the fundamental setup is not uniformly negative. The question the market will answer on earnings day is whether Corning’s optical tailwinds are strong enough to offset the margin and demand concerns. These concerns are already embedded in the stock’s severe technical deterioration.
Bullish Scenario: Earnings Beat Triggers a Technical Recovery
The bull case for GLW stock rests on a clear foundation. Corning delivers Q2 results at or above the $0.76 consensus estimate. Strong Optical Communications revenue and Life Sciences momentum provide upside surprises that shift sentiment. The EMA200 at $142.57 holds as support, confirming the level as a genuine base. A recovery through the daily pivot at $142.79 and toward the hourly resistance cluster around $146–$149 would represent the first meaningful technical repair.
For a more sustained recovery, GLW would need to reclaim the EMA20 on the daily at $171.63. That is a formidable distance from current levels. However, it is achievable in a post-earnings momentum surge if the AI fiber narrative accelerates. The wide Bollinger Band structure suggests capacity for large moves in either direction.
Bearish Scenario: Earnings Disappoint and Support Breaks
On the other hand, the bearish case is well-supported by current technicals. If Q2 results disappoint — through weaker Optical Communications margins, Automotive headwinds, or cautious forward guidance — GLW stock could break below the EMA200 at $142.57. The next meaningful pivot support sits at $136.88 (daily S1). Below that, the daily Bollinger Band lower boundary at $119.71 becomes the structural downside target in a worst-case unwind.
The MACD histogram widening on the daily, the bearish hourly regime, and the sustained gap between price and short-term EMAs all suggest selling momentum has not been exhausted. A failed earnings reaction would simply confirm that the technical deterioration reflects something more fundamental than a temporary dislocation.
Positioning and Volatility: A Difficult Environment for Conviction
Overall, GLW stock sits at a technically precarious but fundamentally interesting crossroads. The daily chart favors bears, the hourly confirms it, and only the 15-minute frame offers a brief window of tactical consolidation. The EMA200 at $142.57 is the single most important near-term level. A hold keeps the door open for recovery, while a break invites significantly more downside.
The ATR of $12.17 on the daily underscores the volatility risk around earnings. Positions of any directional conviction should account for wide intraday swings that can easily exceed typical risk tolerance. Momentum indicators are approaching but not yet at oversold extremes. With the earnings catalyst imminent, the honest assessment is that GLW stock is in a high-uncertainty zone. The technical thesis is bearish, but the fundamental catalyst could override it quickly — in either direction.
FAQ
What is the key support level for GLW stock?
The EMA200 at $142.57 is the most critical near-term support for GLW stock. A hold above this level keeps the door open for recovery. A break below it would invite significantly more downside, with the next pivot support at $136.88 (daily S1).
What is the consensus earnings estimate for Corning’s Q2?
Wall Street analysts raised the quarterly earnings estimate to $0.76 per share. This is driven by projected strength in Life Sciences and Optical Communications, partially offset by softer Automotive demand.
Is GLW stock oversold right now?
The daily RSI at 35.44 is approaching oversold territory but has not yet reached it. Oversold readings near 30 would signal potential seller exhaustion. At 35, there is still room for further deterioration before a reversal signal emerges.
What are the main fundamental drivers for Corning?
AI-related fiber and optical demand are the primary tailwinds. Corning’s cell culture business has also attracted analyst attention as a secondary growth narrative. The AI-driven optical business and solar growth support the company’s outlook heading into earnings.
Disclaimer: This article is for informational purposes only and does not constitute financial advice, an investment recommendation, or a solicitation to buy or sell any financial instrument or cryptocurrency. The analysis provided is not indicative of future results. Investing in crypto assets and financial markets carries a high risk of capital loss. Always do your own research (DYOR) and consult a qualified financial advisor before making any decision.
Article produced with the assistance of artificial intelligence and reviewed by the editorial team.
