




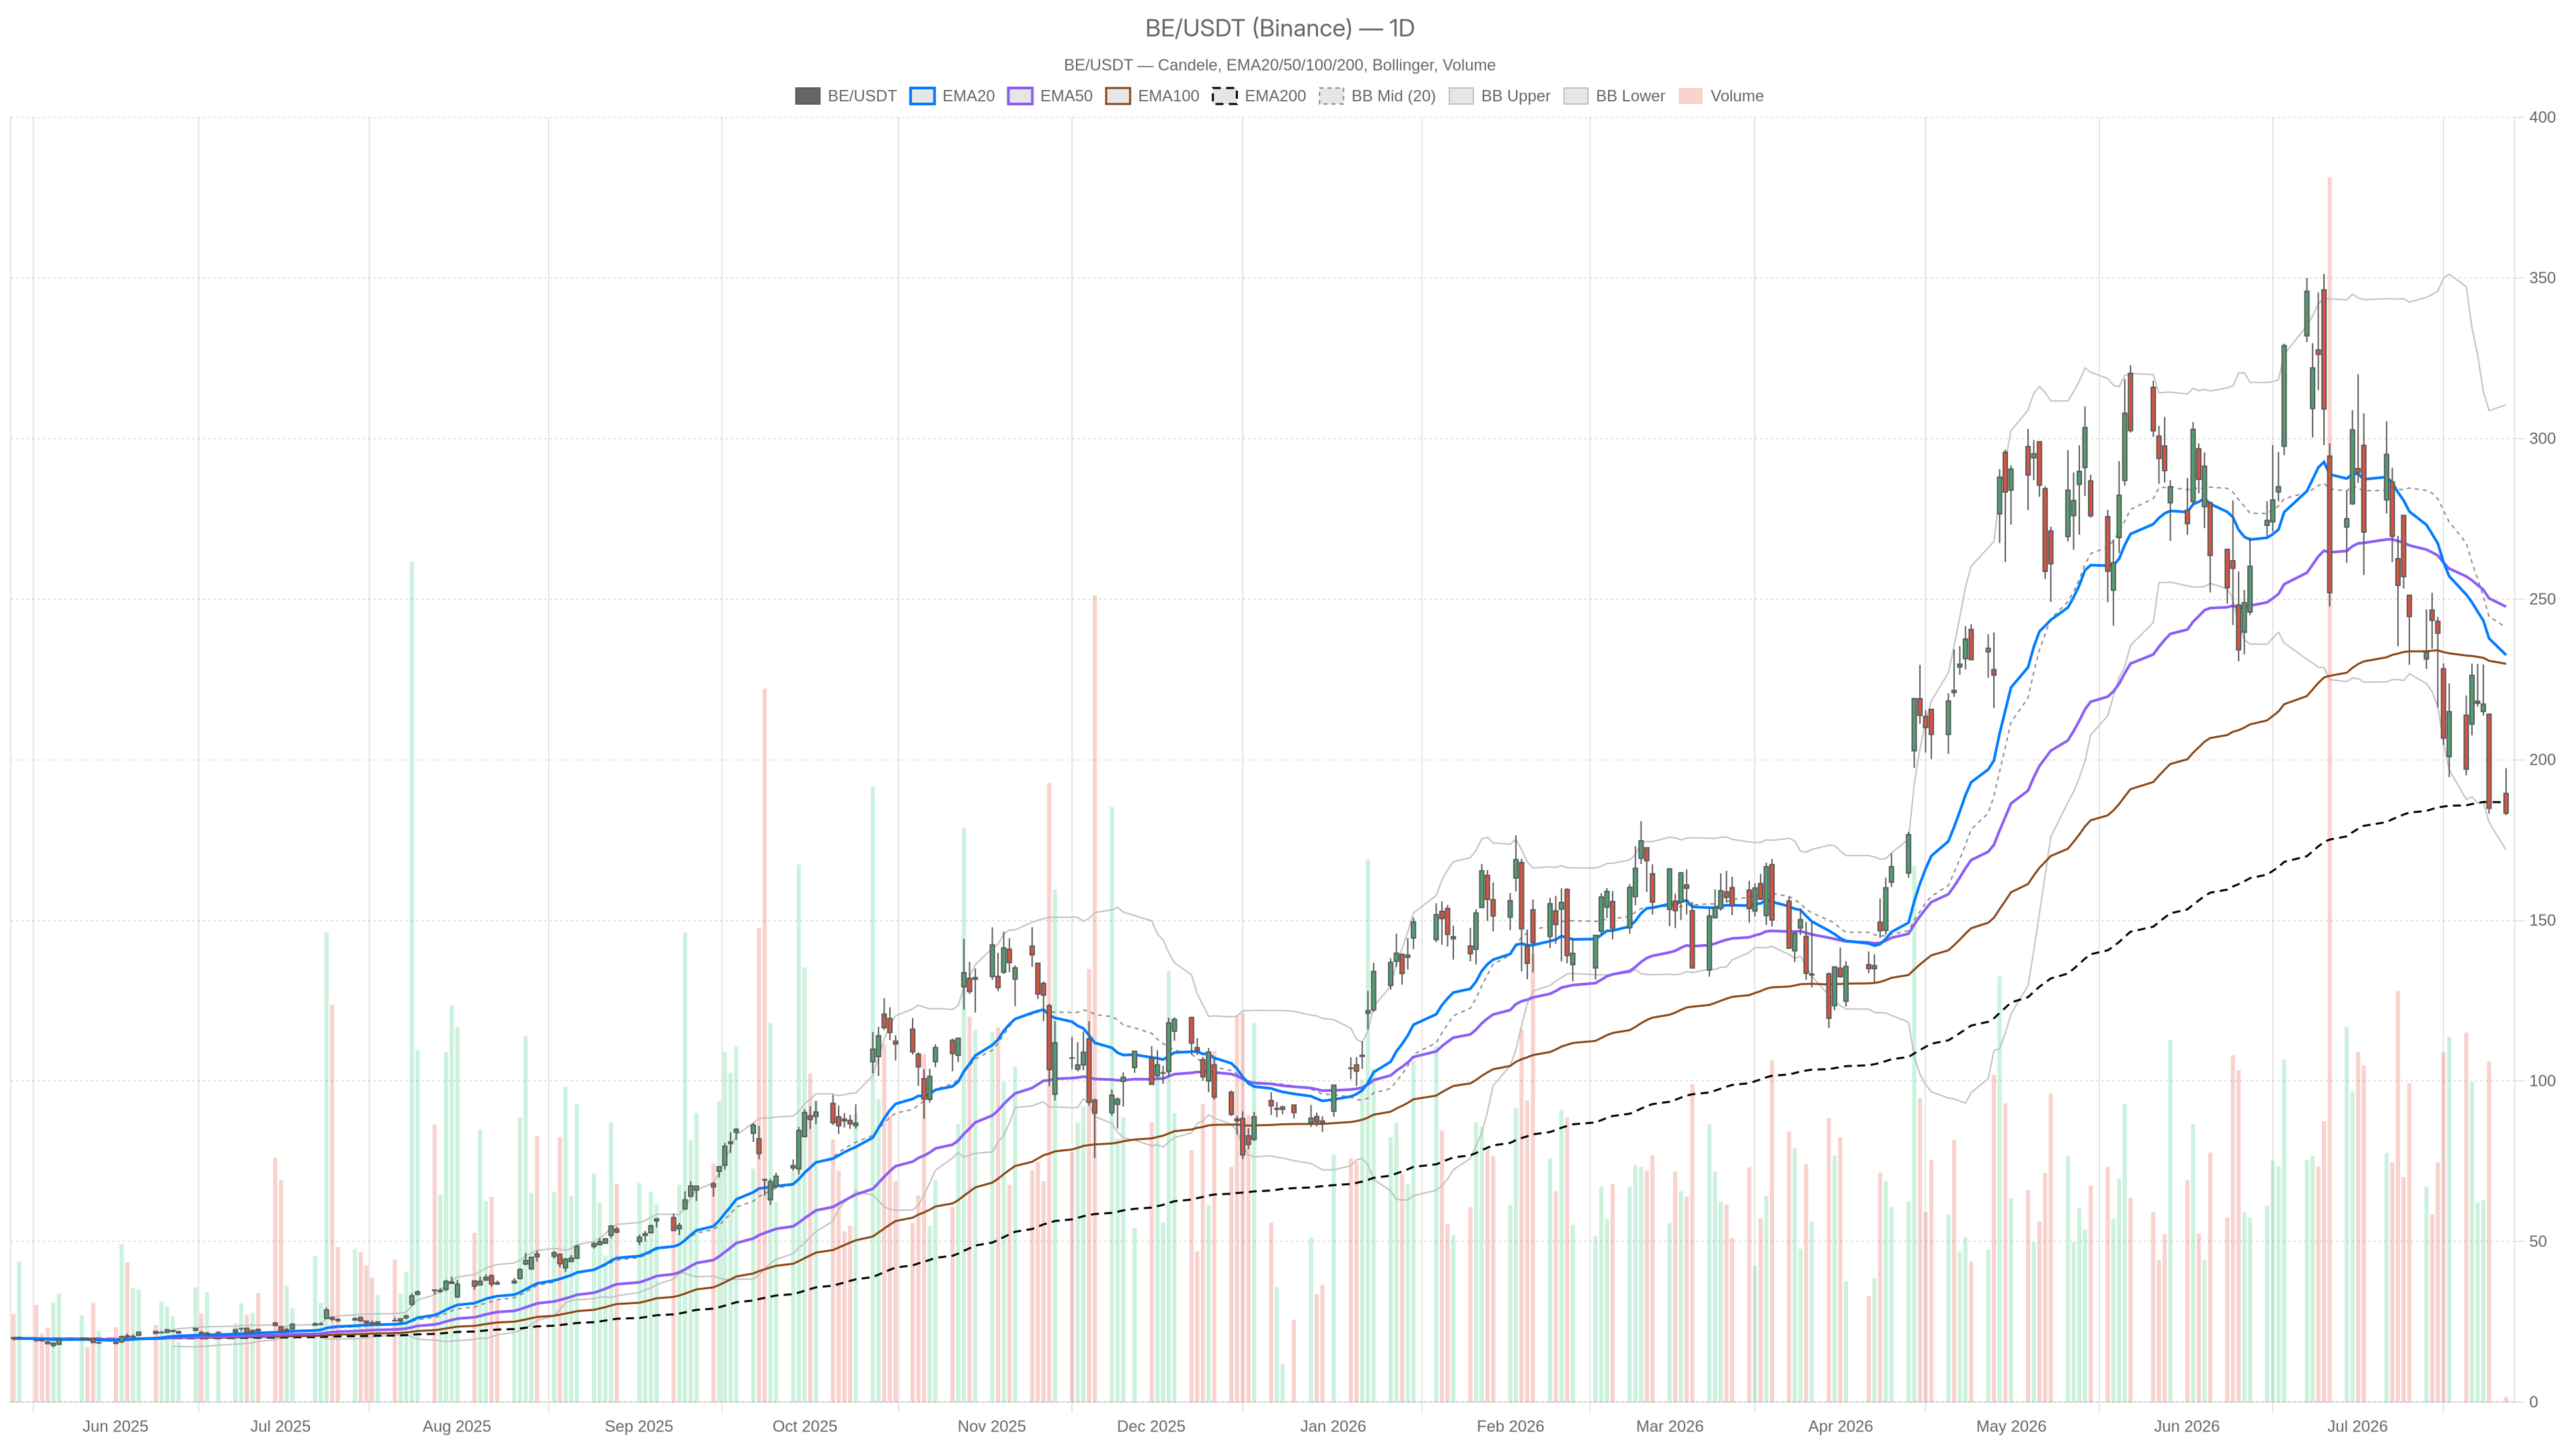
Bloom Energy Corporation stock closed at $183.36 on July 27, deep below every meaningful moving average. The daily, hourly, and 15-minute charts all confirm bearish control. Yet Q2 results due July 28 could upend the technical picture entirely — making this one of the most complex setups in the current market.
Summary
Key takeaways
- BE closed at $183.36 on July 27, well below the EMA20 at $232.59 and the EMA50 at $247.64
- The daily RSI at 35.86 hovers near oversold, while the MACD histogram at -5.64 continues expanding bearishly
- The EMA200 at $186.78 is the lone structural floor — reclaiming it would be the first recovery signal
- Q2 earnings on July 28 are the central catalyst; the stock has shed approximately 43% over the past month
- Daily ATR of $24.96 signals extreme volatility, demanding disciplined position sizing through the event
Daily Bias for Bloom Energy Corporation Stock: Bearish Structure With a Floor Forming
Trend and Moving Average Structure
The daily bias for Bloom Energy Corporation stock is clearly bearish. Price sits at $183.36, far below both the EMA20 at $232.59 and the EMA50 at $247.64. These levels represent a sustained distribution phase, not mere trailing indicators. Price has been rejected below its medium-term trend for an extended period.
Notably, the EMA200 on the daily sits at $186.78 — barely above current price. This is the one structural element that prevents the chart from being entirely one-sided. A close above $186.78 would put price back above its long-term average. That could shift the regime reading from neutral toward recovery.
Momentum and Volatility Signals
The daily RSI at 35.86 hovers just above oversold territory. It does not signal imminent reversal. However, it confirms the stock has been heavily sold. Meanwhile, the MACD tells a harsher story: line at -21.98 against a signal of -16.34, with a histogram of -5.64. Momentum is deeply negative. The histogram is still expanding bearishly. There is no divergence — sellers remain in charge.
Meanwhile, the Bollinger Bands reinforce this picture. The midband sits at $241.18, far above current price. The lower band at $171.89 defines the next zone of potential compression. Price trades near the lower half of the band range. The stock is stretched but not yet at an extreme. The ATR of $24.96 signals unusually high daily volatility. A single session can produce a substantial price swing — critical ahead of earnings.
Overall, daily pivot analysis places the pivot point at $187.82. Resistance R1 at $192.88 and support S1 at $178.30 frame the immediate battlefield. The stock closed below the pivot, confirming the bearish intraday tone on July 27.
Hourly Timeframe: Confirming Weakness, Approaching Extremes
The hourly chart reinforces the bearish daily narrative without complication. Price trades below the EMA20 at $205.37, below the EMA50 at $216.01, and dramatically below the EMA200 at $249.95. Every major average is stacked against the bulls on this timeframe.
However, the 1H RSI at 26.72 is pushing into oversold territory. This is not a buy signal. It warns that selling pressure is becoming extreme in the short run. In a bearish regime, oversold RSI more often reflects continued weakness than imminent reversal — unless a catalyst intervenes.
The 1H MACD confirms the same dynamic. With the line at -8.97 against a signal of -5.12, the histogram sits at -3.85. Hourly momentum is deteriorating and has not yet shown any sign of curling back. In contrast to the daily ATR of nearly $25, the 1H ATR of $7.80 shows elevated intraday volatility. Each hourly bar carries significant risk.
Notably, the 1H Bollinger lower band at $180.74 is now very close to current price. Price has nearly tagged the lower band. This could induce a short-term mean-reversion bounce toward the midband at $211.22. However, such a move would be a counter-trend reaction within a larger bearish structure.
15-Minute Context: No Relief in Sight Yet
The 15-minute chart offers no relief from the bearish pressure. All three EMAs — at $192.48, $202.53, and $217.26 — are stacked above price. This confirms short-term distribution. The RSI at 27.59 is also near oversold. Meanwhile, the 15m MACD histogram of -0.04 is essentially flat. This suggests selling momentum is decelerating slightly but has not reversed.
For execution context, the 15m pivot structure offers tight boundaries: R1 at $185.37 and S1 at $182.05. Price closed at $183.36, sitting between S1 and the pivot at $184.07. This is not a setup for aggressive long entries without confirmation. The short-term structure remains fragile.
The Earnings Catalyst: A Credible Reversal Trigger
The earnings report due July 28 is the central variable for Bloom Energy Corporation stock right now. The narrative around BE has centered on its positioning in data center power infrastructure. Commentary frames the company as a beneficiary of the AI infrastructure buildout. One widely circulated perspective even describes Bloom Energy as potentially becoming the energy equivalent of a major semiconductor supplier for data centers.
At the same time, the stock has shed approximately 43% over the past month, according to available market commentary. The contracted backlog and cash position are cited as remaining constructive even during this decline. This creates genuine tension: price action signals capitulation. Yet the fundamental story — if confirmed by Q2 results — could represent a powerful re-rating event.
Therefore, the earnings report is not peripheral context. It is the central variable. A strong Q2 print could trigger a violent short-covering rally given the oversold conditions across all timeframes. On the other hand, disappointing results into an already-weak price structure could accelerate the decline. The next target would be the daily Bollinger lower band near $171.89.
Bullish Scenario: What Would Support a Recovery
A bullish recovery in Bloom Energy Corporation stock requires a catalyst — and that catalyst is earnings. If BE delivers Q2 results exceeding expectations, the oversold RSI on both daily and hourly frames creates fuel for a sharp recovery. A close back above the EMA200 at $186.78 on the daily would be the first meaningful structural signal. From there, reclaiming the daily pivot at $187.82 and R1 at $192.88 would confirm buyer re-engagement.
Meanwhile, the AI-driven demand narrative provides a fundamental framework. If management confirms continued backlog growth and reaffirms guidance for data center deployments, institutional investors who sold during the 43% decline may revisit their positions aggressively. The compressed valuation after such a sharp drawdown makes the risk-reward asymmetric. But this holds only if the numbers hold up.
Bearish Scenario: What Would Invalidate the Bullish Case
The bearish case for BE requires no catalyst — it is the current trend simply continuing. If Q2 results disappoint, or if guidance underwhelms, the lack of technical support between $183 and the lower Bollinger at $171.89 makes further downside entirely plausible. The daily MACD histogram is still expanding negatively. There are no signs of accumulation on the 15m or hourly charts.
In that scenario, a failure to reclaim the $186.78 EMA200 level would confirm that even the most structurally important average is offering resistance. A test of S1 at $178.30 becomes the base case. The $171.89 Bollinger lower band would be the next target. With an ATR of nearly $25 on the daily, those levels could be reached within one or two sessions.
Positioning Into Uncertainty
Overall, Bloom Energy Corporation stock presents a high-conviction bearish technical setup colliding with a high-impact fundamental event. The price structure is broken across all timeframes. Momentum remains negative. Volatility is elevated, confirmed by an ATR approaching $25 on the daily. Position sizing demands discipline regardless of directional view.
The earnings catalyst on July 28 is the only legitimate reason to entertain a counter-trend long position. Even then, only on confirmed price action following the report. The oversold readings across RSI on both daily and hourly charts do not change the trend. They simply indicate the trend has been aggressive. Traders approaching BE from either direction should expect volatility to remain elevated through the event. This is not an environment for complacency.
FAQ
What is the current technical outlook for Bloom Energy Corporation stock?
The technical outlook is bearish across all timeframes. BE closed at $183.36 on July 27, below the EMA20 at $232.59, EMA50 at $247.64, and just under the EMA200 at $186.78. Both daily and hourly MACD histograms remain negative and expanding, with no divergence signals suggesting an imminent turn.
Why are Q2 earnings so critical for BE stock?
Q2 earnings on July 28 represent a potential regime-changing catalyst. The stock has declined approximately 43% over the past month. If results confirm the AI data center narrative, the oversold conditions across timeframes could fuel a sharp recovery. Disappointing results, however, could accelerate the decline toward the daily Bollinger lower band at $171.89.
What levels should traders watch after earnings?
On the upside, $186.78 — the EMA200 on the daily chart — is the first structural recovery signal. Above that, the daily pivot at $187.82 and R1 at $192.88 would confirm buyer re-engagement. On the downside, a break below $183 opens the path to S1 at $178.30, with $171.89 as the next major support.
Is BE stock oversold enough to expect a bounce?
The daily RSI at 35.86 and hourly RSI at 26.72 indicate heavy selling pressure. However, oversold readings alone do not signal reversal. In a bearish regime, oversold RSI often reflects continued weakness rather than an imminent bounce — absent a catalyst such as the Q2 earnings report.
Disclaimer: This article is for informational purposes only and does not constitute financial advice, an investment recommendation, or a solicitation to buy or sell any financial instrument or cryptocurrency. The analysis provided is not indicative of future results. Investing in crypto assets and financial markets carries a high risk of capital loss. Always do your own research (DYOR) and consult a qualified financial advisor before making any decision.
Article produced with the assistance of artificial intelligence and reviewed by the editorial team.
