




AstraZeneca PLC stock faces a split narrative. Q2 earnings beat estimates on strong cancer drug sales. However, the daily chart remains locked in a bearish regime. The tension between improving fundamentals and deteriorating price structure defines the challenge for AZN.
Summary
Key takeaways
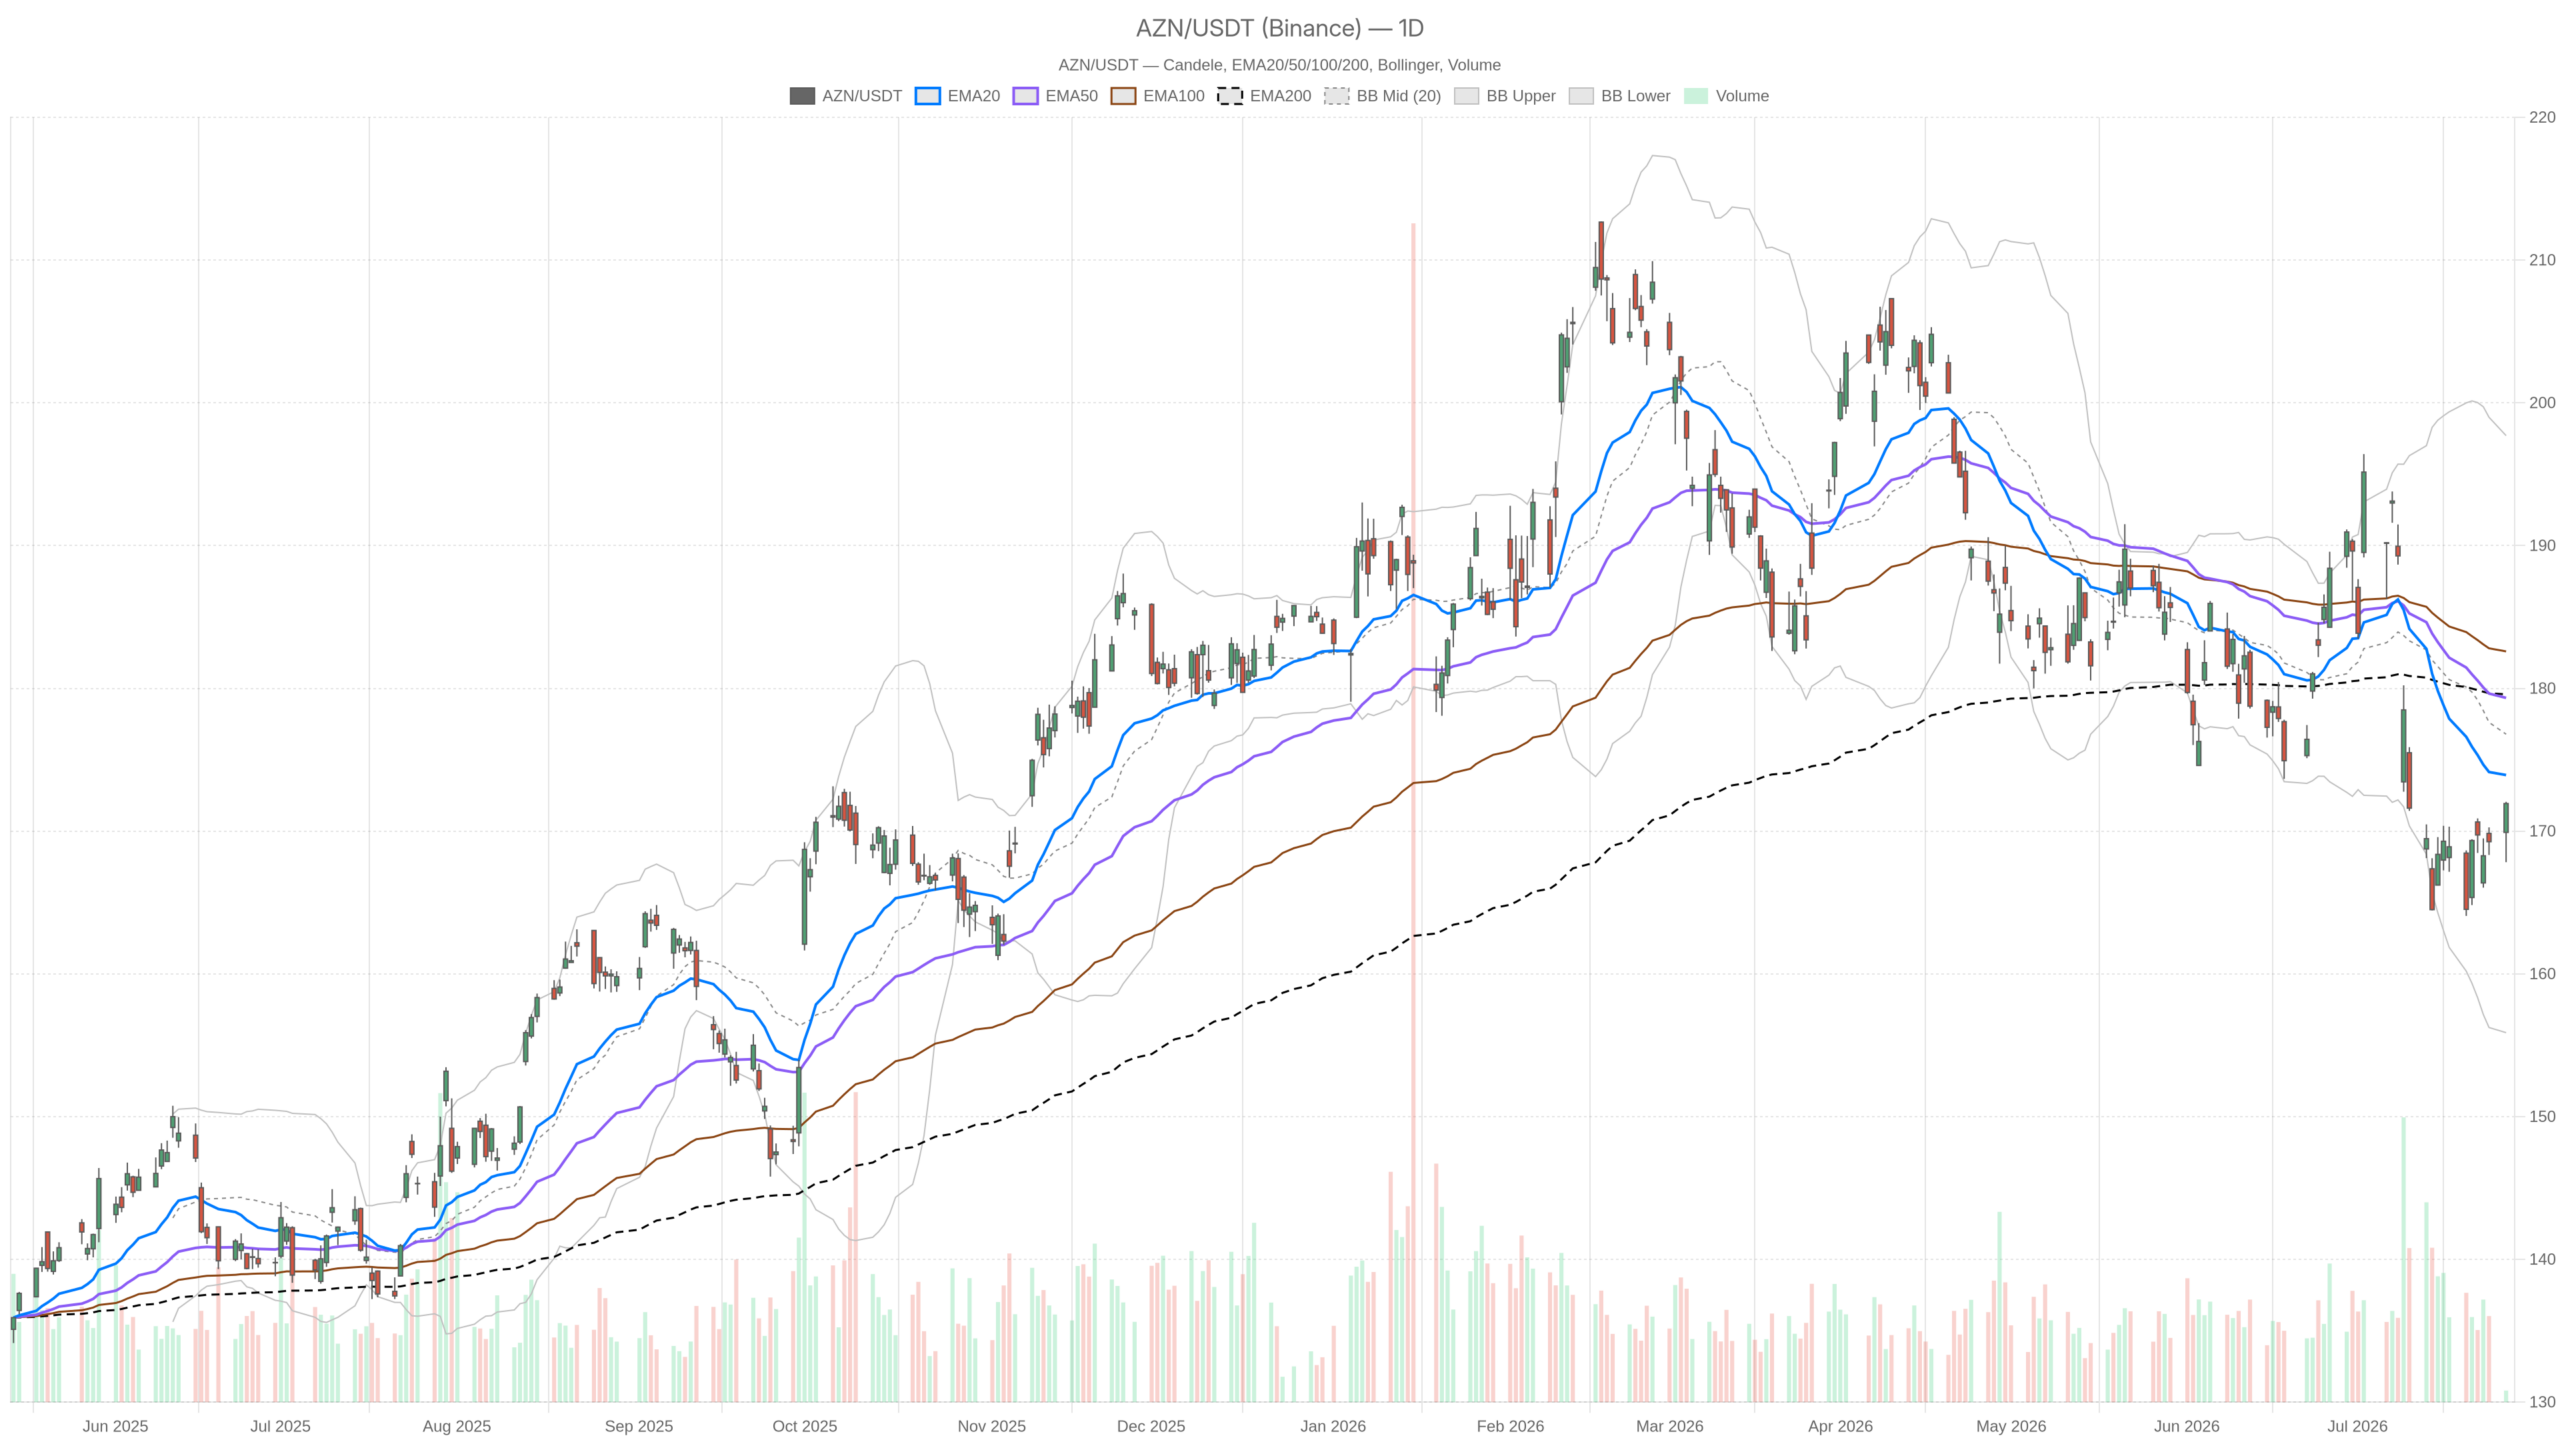
- AZN closed at 171.93 on July 27, below all three daily moving averages — EMA20, EMA50, and EMA200.
- Daily RSI at 45.53 confirms a bearish bias without reaching oversold extremes, leaving room for further downside.
- The Q2 earnings beat was driven by oncology — Tagrisso, Imfinzi, and Enhertu — with the company reiterating its full-year outlook.
- The 173.38–173.93 resistance cluster is the critical level bulls must reclaim to challenge the bearish structure.
- Daily ATR of 5.00 signals meaningful volatility, allowing sharp moves in either direction within a single session.
Daily bias — the bearish regime holds
The daily trend on AstraZeneca PLC stock remains decisively bearish. AZN closed at 171.93 on July 27. Price sits below the EMA20 at 173.93. The EMA50 at 179.33 and EMA200 at 179.58 both tower above current levels. All three moving averages are stacked above price — a classically bearish alignment. The burden of proof rests squarely with the bulls.
The daily MACD reinforces this view. The MACD line stands at -3.93, below the signal line of -3.66. This generates a negative histogram of -0.27. The line remains in negative territory and the histogram is extending to the downside. Bearish momentum has not yet exhausted itself.
Notably, daily RSI at 45.53 adds nuance. The reading sits below the 50 midline, confirming a seller bias without reaching extremes. There is room to fall further before any mechanical oversold bounce becomes probable. This is not a stock technically stretched to the downside — it is simply trending lower.
Meanwhile, daily Bollinger Bands are wide: upper at 197.70, lower at 155.88, mid at 176.79. Price is trading below the midline. Daily volatility as measured by ATR14 at 5.00 is meaningful. A single session swing of that magnitude means AZN can cover significant ground quickly in either direction.
Intraday picture — a contradicting short-term pulse
The hourly chart tells a different story, offering short-term bullish signals that contradict the daily downtrend in AZN. Price has pushed above both the 1H EMA20 at 169.08 and EMA50 at 169.46. The hourly MACD line at 0.39 crosses above its signal at 0.20. A positive histogram of 0.18 confirms that short-term momentum has shifted in favour of buyers.
However, the 1H EMA200 sits at 176.10 — well above current price. Even on the hourly chart, the medium-term structure is not clean. The regime is flagged as neutral, not bullish. The intraday bounce is real, but it has not broken the broader suppression of price action.
Notably, the 1H RSI at 65.59 is approaching overbought territory. It does not signal an immediate reversal. At this reading, however, the short-term upside push is losing easy ground. Further progress toward R1 resistance at 173.38 will face increasing friction.
At the same time, the 1H Bollinger upper band sits at 170.87. The close at 171.93 is already above it. A close outside the upper band signals momentum overextension in the near term. It does not invalidate the move, but it raises the probability of consolidation or a brief pullback.
15-minute context — extended and overbought at the open
On the 15-minute chart, AstraZeneca PLC stock looks even more stretched. RSI14 at 77.71 sits firmly in overbought territory. The MACD histogram at 0.31 is running hot. Price trades above all three 15m moving averages — EMA20 at 169.55, EMA50 at 169.11, and EMA200 at 169.15. The very short-term trend is upward, but momentum conditions make this an uncomfortable entry for buyers.
The 15m ATR14 of 0.67 keeps individual bar risk manageable. Nonetheless, the overbought RSI on this timeframe suggests elevated short-term reversal risk for any tactical long entry. This is purely execution context — not a framework for the larger thesis.
Pivot levels and key technical reference points
Key pivot levels across timeframes converge to define clear support and resistance zones for AZN. The pivot point sits at 170.60, with R1 resistance at 173.38 and S1 support at 169.15. AZN closed at 171.93 on July 27, placing it between the pivot and R1. The first significant upside test is a push through 173.38. This level aligns closely with the daily EMA20 at 173.93. Together, they form the 173.38–173.93 resistance cluster just above current price.
On the downside, S1 at 169.15 is the immediate floor. A daily close below that level would suggest the intraday bounce was corrective. It would confirm the broader downtrend rather than signalling a genuine recovery.
The fundamental catalyst — Q2 earnings and what they change
AstraZeneca PLC stock’s fundamental backdrop improved after first-half 2026 results beat expectations. Revenue grew 6% at constant exchange rates. Excluding generic competition impacts on Farxiga and Brilinta, that figure rises to 11%. Core earnings per share increased 11%. The Q2 beat was driven by oncology — Tagrisso, Imfinzi, and Enhertu all contributed to the upside. The company reiterated its full-year outlook, signalling management confidence in the trajectory.
Additionally, AZN’s participation in the Billion Cell Atlas alliance adds a longer-term pipeline narrative. This large-scale genomic and CRISPR-based drug discovery initiative was highlighted alongside Illumina. These are credible fundamental supports. The question is whether they can break a technically deteriorating trend.
Bullish scenario — earnings catalyse a structural recovery
For bulls, the path to a structural recovery in AstraZeneca PLC stock runs through the 173.38 resistance. A sustained move above 173.38 — clearing both R1 and the daily EMA20 — would be the first meaningful technical confirmation of improving price structure. A subsequent recapture of the EMA50 region near 179.33 would represent a genuine regime shift on the daily chart. The fundamental backdrop supports such a narrative. A Q2 beat, a reiterated full-year outlook, and a strong oncology franchise are exactly the kind of catalysts that can override near-term technical weakness.
In this scenario, the 1H and 15m momentum already offer short-term evidence. The intraday trend is constructive and the hourly MACD is positive. A continuation of the upward momentum, paired with volume expansion, would be the execution signal bulls want to see.
Bearish scenario — a bounce within a downtrend
The bearish case for AstraZeneca PLC stock treats the current bounce as temporary relief within a larger downtrend. The daily structure is unambiguous. EMA20, EMA50, and EMA200 are all above price. The MACD remains deeply negative on the daily chart. RSI has not yet recovered above 50. These are not conditions that typically precede sustained rallies without first working through a consolidation phase.
In the bearish scenario, the current intraday bounce is simply a post-earnings relief move. A failure at the 173.38–173.93 resistance cluster would confirm that daily selling pressure is intact. A subsequent break below S1 at 169.15 would strengthen the bear case. A drop toward the daily Bollinger lower band at 155.88 would validate it fully. The stretched 15m RSI and the hourly band breach both add weight to the argument that this bounce may be running out of fuel.
Positioning, volatility, and the uncertainty at hand
AstraZeneca PLC stock sits at a genuine inflection point between conflicting fundamental and technical signals. The earnings beat is real. The oncology story is credible. The intraday momentum is briefly constructive. Yet none of that has yet translated into a change in the daily trend regime. With a daily ATR of 5.00 and a Bollinger band range spanning over 40 points, volatility provides opportunity in both directions.
Overall, the 173.38–173.93 cluster is the level to watch. A clean daily close above it would begin to challenge the bearish structure. A rejection there keeps sellers firmly in charge. Until that test resolves, uncertainty dominates. AZN remains a stock where the fundamental and technical narratives are pulling in opposite directions.
FAQ
Is AstraZeneca PLC stock in a bull or bear market on the daily chart?
The daily chart shows a bearish structure. AZN closed at 171.93, below the EMA20 (173.93), EMA50 (179.33), and EMA200 (179.58). The daily MACD is negative at -3.93 with a bearish histogram, and RSI reads 45.53 — below the 50 midline. The trend is down until proven otherwise.
What resistance level must AstraZeneca PLC stock break to reverse the bearish trend?
The critical resistance cluster sits between 173.38 (R1 pivot) and 173.93 (daily EMA20). A clean daily close above this zone would deliver the first meaningful challenge to the bearish structure. A further recapture of the EMA50 near 179.33 would confirm a genuine regime shift on the daily chart.
Did AstraZeneca’s Q2 2026 earnings beat expectations?
Yes. First-half 2026 revenue grew 6% at constant exchange rates, or 11% excluding generic competition impacts on Farxiga and Brilinta. Core EPS rose 11%. The beat was powered by oncology drugs — Tagrisso, Imfinzi, and Enhertu. The company also reiterated its full-year outlook.
What is the key downside support level for AZN?
S1 support at 169.15 is the immediate floor. A daily close below this level would suggest the intraday bounce was merely corrective within the broader downtrend. The daily Bollinger lower band at 155.88 represents a deeper support zone if selling pressure intensifies.
Disclaimer: This article is for informational purposes only and does not constitute financial advice, an investment recommendation, or a solicitation to buy or sell any financial instrument or cryptocurrency. The analysis provided is not indicative of future results. Investing in crypto assets and financial markets carries a high risk of capital loss. Always do your own research (DYOR) and consult a qualified financial advisor before making any decision.
Article produced with the assistance of artificial intelligence and reviewed by the editorial team.
