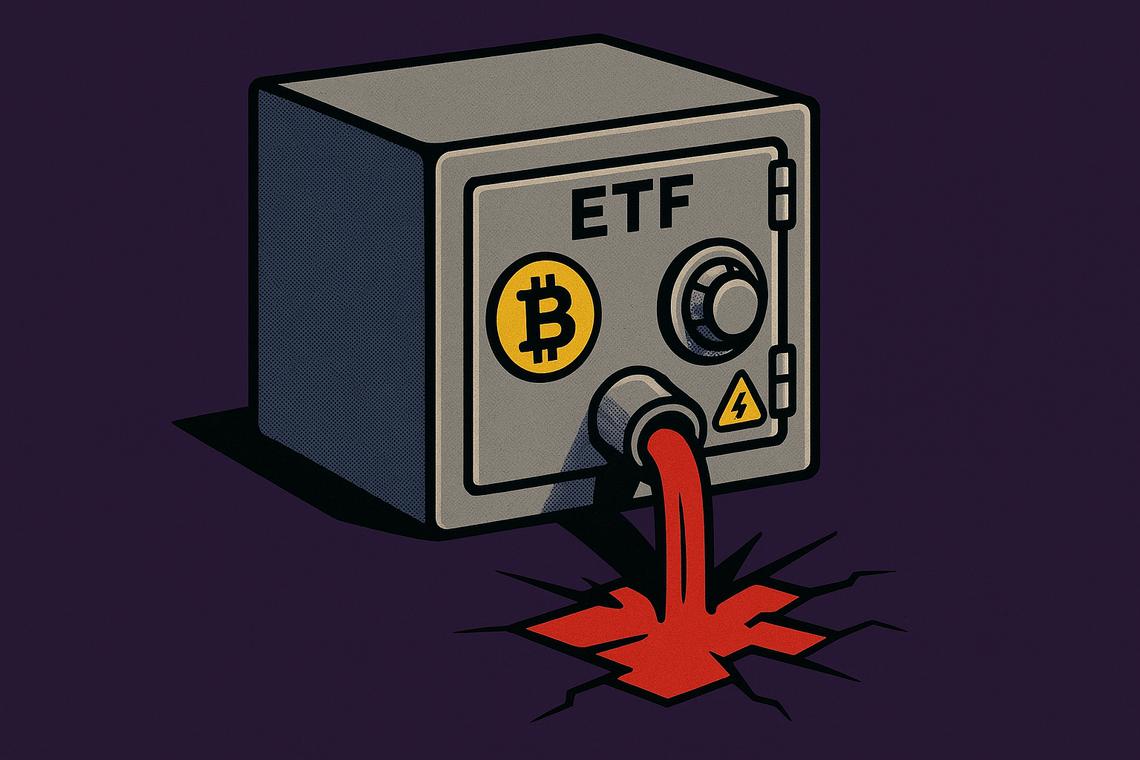
A seven-day run of net inflows into US spot Bitcoin ETFs came to an abrupt halt on July 24, 2026, as the funds posted $225.2 million in net outflows — their first negative session since July 13. The reversal arrived at an uncomfortable moment: Bitcoin briefly slipped below $65,000 as US stocks fell amid renewed tensions between Washington and Tehran, leaving investors to weigh how much of the pullback reflects genuine risk aversion versus a routine pause in an otherwise recovering trend.
Summary
Key takeaways
- US-listed spot Bitcoin ETFs recorded $225.2 million in net outflows on July 24, 2026, ending a seven-day inflow streak.
- The prior seven sessions had attracted nearly $1 billion in net inflows, according to SoSoValue data.
- Despite Thursday’s outflows, the funds still logged roughly $274 million in net inflows for the week up to that date.
- Bitcoin fell as low as $64,600 before recovering to $65,403 at publication, per CoinGecko.
- US-listed spot Ether ETFs bucked the trend, extending their own inflow streak to five consecutive days with $26.3 million in net inflows on the same day.
Bitcoin ETFs End Seven-Day Inflow Streak
The scale of the streak that just ended deserves some context. Over seven consecutive trading sessions, US spot Bitcoin ETFs pulled in nearly $1 billion in net inflows, according to SoSoValue — their longest consecutive run since a five-session stretch between April 30 and May 6. That momentum had been building steadily, with the funds registering $226.9 million in a single session on July 21 alone, the strongest daily figure since July 6.
Then Thursday arrived. The $225.2 million in net Bitcoin ETF outflows snapped that momentum in a single session, marking the first day of net redemptions in more than a week. The timing, coinciding with a broader equity selloff tied to US-Iran geopolitical tensions, suggested that macro jitters — not a fundamental shift in crypto demand — drove the move.
Weekly inflow context despite outflows
One day of outflows does not erase a week of progress. Despite the Thursday reversal, the funds had still attracted approximately $274 million in net inflows for the week as a whole up to that point. That figure keeps the weekly picture firmly positive, even if the streak itself is now broken.
That distinction matters for how investors should read the data. A single outflow session within an otherwise strong weekly performance looks very different from the kind of sustained redemption pressure that weighed on these products earlier in 2026, when US spot Bitcoin ETFs carried roughly $4.84 billion in net outflows for the year. The latest streak, while now interrupted, had been narrowing that annual deficit.
Bitcoin Price and Market Sentiment Amid US-Iran Tensions
The price pressure on July 24 was real but contained. Bitcoin dropped to a session low of $64,600 — briefly crossing below the psychologically significant $65,000 threshold — before rebounding to $65,403 at the time of publication, according to CoinGecko. The move tracked a broader risk-off shift in US equities, with renewed US-Iran tensions cited as the catalyst for falling stock prices.
Market sentiment indicators
Sentiment had already been fragile heading into Thursday. The Crypto Fear & Greed Index, tracked by Alternative.me, fell 3 points to 28 on July 24, keeping the reading firmly in “fear” territory. That reading reflects a market still dominated by caution — not the kind of broad optimism that typically accompanies sustained institutional accumulation.
What makes this moment analytically interesting is the resistance level that had been identified even before the outflows. Simon-Peter Massabni, head of business development at XS.com, noted earlier in the week that Bitcoin would need to break and hold above the $65,000–$65,500 range to strengthen the case for a sustained uptrend, and that the recent inflow streak pointed more toward easing selling pressure than a definitive return of institutional demand. Thursday’s price action and sentiment data did little to challenge that reading.
Ether ETFs Continue Inflow Streak
While Bitcoin ETF flows reversed, Ether told a different story. US-listed spot Ether ETFs extended their inflow streak to five consecutive days on July 24, adding $26.3 million in net inflows, according to SoSoValue. The divergence is notable: on the same day that Bitcoin-focused products faced $225 million in redemptions, Ether products quietly kept attracting fresh capital.
That split hints at a degree of independent momentum in the Ethereum ETF market that is not simply following Bitcoin’s lead. Whether that divergence persists — or whether a prolonged macro risk-off environment eventually pulls both asset classes in the same direction — is the question hanging over the coming sessions.
For now, the broader picture is one of a market that absorbed a significant geopolitical shock without a complete collapse in institutional flows. The weekly net positive for Bitcoin ETFs, combined with Ether’s unbroken inflow streak, suggests the underlying demand structure remains intact. But with the Fear & Greed Index still deep in fear territory and Bitcoin trading just above a contested support level, the next few sessions will carry outsized weight in determining whether July 24 was a one-day pause or the start of a broader reversal.
FAQ
What caused the end of the Bitcoin ETF inflow streak?
US-listed spot Bitcoin ETFs ended a seven-day inflow streak on July 24, 2026, recording $225.2 million in net outflows. The reversal coincided with renewed US-Iran geopolitical tensions that pushed US stock markets lower and briefly dragged Bitcoin below $65,000.
How did Bitcoin’s price react on July 24, 2026?
Bitcoin fell as low as $64,600 during the session before recovering to $65,403 at the time of publication, according to CoinGecko. The dip briefly breached the $65,000 level that analysts had identified as a key support threshold.
Did Ether ETFs follow the same outflow trend as Bitcoin ETFs?
No. US-listed spot Ether ETFs moved in the opposite direction, extending their inflow streak to five consecutive days and attracting $26.3 million in net inflows on July 24, 2026, according to SoSoValue.
What is the market sentiment according to the Crypto Fear & Greed Index?
The Crypto Fear & Greed Index fell 3 points to 28 on July 24, 2026, remaining in “fear” territory, according to Alternative.me. The reading indicates continued caution among market participants despite the partial price recovery.
Article produced with the assistance of artificial intelligence and reviewed by the editorial team.