



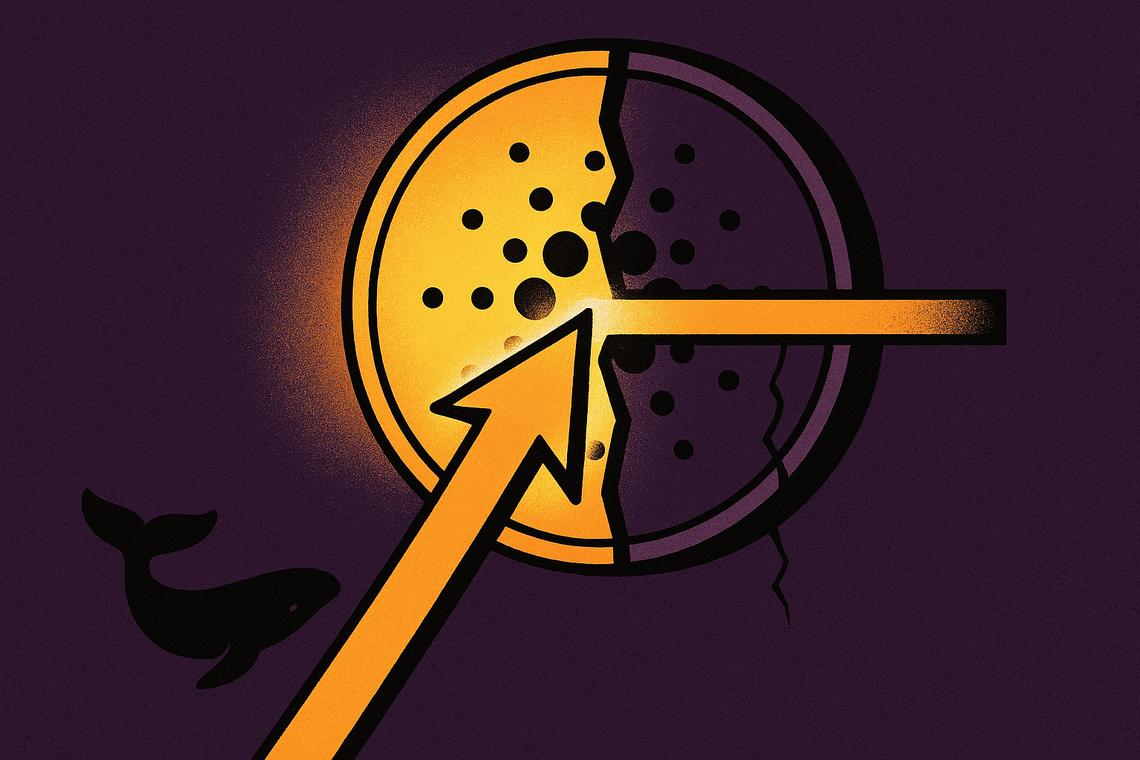
Something doesn’t quite add up in Cardano’s market right now. The Cardano ADA market outlook is sending traders in two directions at once — large holders are quietly buying, yet short sellers are paying a premium to hold bearish bets. That tension, sitting just below a wall of technical resistance, is what makes the current moment worth watching closely.
Summary
Key takeaways
- ADA is trading below $0.168 after being rejected at the 50-day EMA near $0.176, keeping the medium-term structure bearish.
- The long-to-short ratio stands at 1.07 — modestly bullish — but perpetual futures funding rates turned negative at approximately -0.014, reflecting competing sentiment signals.
- Large Cardano holders (whales) accumulated roughly 120 million ADA since Monday, according to Santiment data.
- Critical support sits at $0.150 and $0.138 (key Fibonacci level); a break below either level could deepen the sell-off.
- Resistance at $0.176 (50-day EMA) and $0.197 (former downtrend line) must both be cleared for any credible recovery attempt.
Cardano Price and Technical Resistance
ADA’s rejection at the 50-day EMA is more than just a bad day on a chart — it represents the third tier of a stacked technical ceiling that has consistently pushed sellers back into control. After briefly testing the $0.177–$0.178 area, the price retreated and is now grinding below $0.168, unable to maintain the momentum built during two earlier recovery sessions this week.
Current trading levels and rejection at key EMAs
The broader picture is unambiguously bearish by moving average standards. ADA remains below the 50-day EMA at $0.176, the 100-day EMA at $0.202, and the 200-day EMA at $0.267. Being trapped beneath all three of those levels tells a simple story: sellers have been in structural control for a sustained period, and buyers haven’t yet found the conviction to change that.
According to Invezz, ADA futures open interest dropped 4.7% to $411 million while trading volume fell 45% to $329.1 million — a combination that typically signals fading retail participation rather than a healthy consolidation. Long liquidations of $273,040 also outpaced short liquidations of $162,360 during that period, adding more weight to the bearish short-term read.
Important resistance and support levels shaping price trajectory
For the bulls, the math is straightforward but demanding. Two hurdles stand in the way of any meaningful recovery: the 50-day EMA at $0.176 and the former long-term downtrend line, now acting as resistance near $0.197. A sustained close above both would materially shift the near-term picture.
On the downside, the levels to watch are equally clear. Immediate horizontal support sits at $0.150. Below that, the key Fibonacci support at $0.138 becomes the last meaningful line of defense. A break through $0.138 would likely expose ADA to fresh lows and reinforce the prevailing bearish structure — a scenario that becomes more plausible the longer price stays compressed under resistance.
Derivative Market Signals Reflect Mixed Trader Sentiment
The derivatives market is where Cardano’s internal contradiction becomes most visible. Two of the most-watched positioning metrics are currently pointing in opposite directions, creating genuine ambiguity about near-term direction.
CoinGlass data shows ADA’s long-to-short ratio at 1.07 — a reading above 1.0 meaning more traders are positioned for gains than losses. On the surface, that’s a bullish signal. But Cardano’s perpetual futures funding rates flipped negative on Thursday and held at approximately -0.014 on Friday. Negative funding means short sellers are paying long holders, which typically reflects a market where bearish conviction is building, not fading.
This kind of split — bullish positioning but bearish funding — is what makes the current setup tricky to trade. It suggests the market isn’t pricing in a clear directional move. Instead, it reflects genuine disagreement: some traders expect recovery, others are actively leaning into further declines. Earlier in the week, when ADA was closer to the $0.161 range following the Van Rossem hard fork activation, the long-to-short ratio had been below 1.0 at 0.84, meaning short positions outnumbered longs outright. The shift to 1.07 represents a modest sentiment improvement — but the negative funding rate is a meaningful counterweight to that narrative.
Whale Accumulation Amid Market Uncertainty
While retail participants appear to be stepping back, the largest wallets have been doing the opposite. According to Santiment data, wallets holding between 1 million and 100 million ADA have accumulated approximately 120 million ADA since Monday — a notable build-up during a period of price weakness.
Smaller wallets, those in the 100,000 to 1 million ADA range, have shown comparatively little buying activity over the same period. The divergence matters: when large holders accumulate while smaller ones sit on the sidelines, it can indicate that sophisticated, longer-term investors see value at current levels — even if the immediate price action doesn’t yet reflect that view.
That said, whale accumulation alone doesn’t guarantee a trend reversal. Without a corresponding uptick in retail demand and a technical breakout above key levels, the buying could simply represent patient positioning ahead of a catalyst rather than the start of a recovery. The Van Rossem hard fork — which introduced lower smart contract execution costs and enhanced Plutus functionality — has not yet translated into sustained price strength, suggesting the market needs more than fundamental milestones to shift momentum.
Technical Momentum and Market Indecision
The RSI and MACD, two of the most closely watched momentum tools, are both sitting in ambiguous territory. The RSI is hovering near 48 — just below the neutral 50 line — which reflects balanced buying and selling pressure without a dominant trend. It’s neither oversold enough to generate a convincing contrarian bounce signal, nor strong enough to confirm a recovery is underway.
The MACD is sitting slightly above the zero line, hinting that what little bullish momentum exists hasn’t entirely collapsed. But “slightly above zero” is a long way from the kind of MACD reading that typically accompanies a genuine trend reversal. Together, both indicators describe a market caught in between — not breaking down hard, but also not building the base needed to push convincingly through resistance.
The analytical weight of all these signals — weak momentum, negative funding, declining futures volume, price below all major EMAs — points toward a market where seller control remains intact for now. Whale accumulation adds an interesting wrinkle, but the burden of proof still rests with the bulls. Until ADA posts a clean close above $0.176 and then $0.197, the path of least resistance leans lower, and the $0.138 Fibonacci level remains the number that could define how deep this chapter gets.
FAQ
What does Cardano’s current price below the 50-day EMA indicate?
Trading below the 50-day EMA suggests medium-term seller control and an ongoing bearish market structure. ADA has failed to reclaim this level despite brief recovery attempts, keeping the broader technical outlook tilted to the downside.
How do derivatives like the long-to-short ratio and funding rates reflect Cardano’s market sentiment?
The long-to-short ratio of 1.07 shows a modest bullish positioning among leveraged traders, but negative funding rates of approximately -0.014 indicate that short sellers are paying long holders — a sign of growing bearish sentiment. Together, these signals create genuine uncertainty about near-term direction rather than a clear consensus.
What is the significance of whale accumulation of ADA amid price weakness?
Whales — wallets holding between 1 million and 100 million ADA — have accumulated roughly 120 million ADA since Monday, according to Santiment. This may reflect confidence in Cardano’s longer-term outlook, but the buying has not yet been strong enough to reverse the broader bearish trend or trigger increased retail participation.
Which price levels are critical support and resistance for Cardano now?
Resistance is strong at $0.176 (50-day EMA) and $0.197 (former downtrend line), both of which must be cleared for bullish momentum to strengthen. On the downside, support at $0.150 is the immediate line to watch, with the key Fibonacci level at $0.138 below that. A breach of $0.138 could expose ADA to further lows and reinforce the prevailing bearish trend.
Article produced with the assistance of artificial intelligence and reviewed by the editorial team.
