

Apple Stock faces mounting pressure as technicals and fundamentals align bearishly. AAPL closed at $281.74 on June 29, trading below both its 20-day and 50-day EMAs. Momentum indicators confirm a deteriorating trend. Chip sourcing controversies and price hike concerns add further headwinds. For now, the path of least resistance points lower.
Summary
Key takeaways
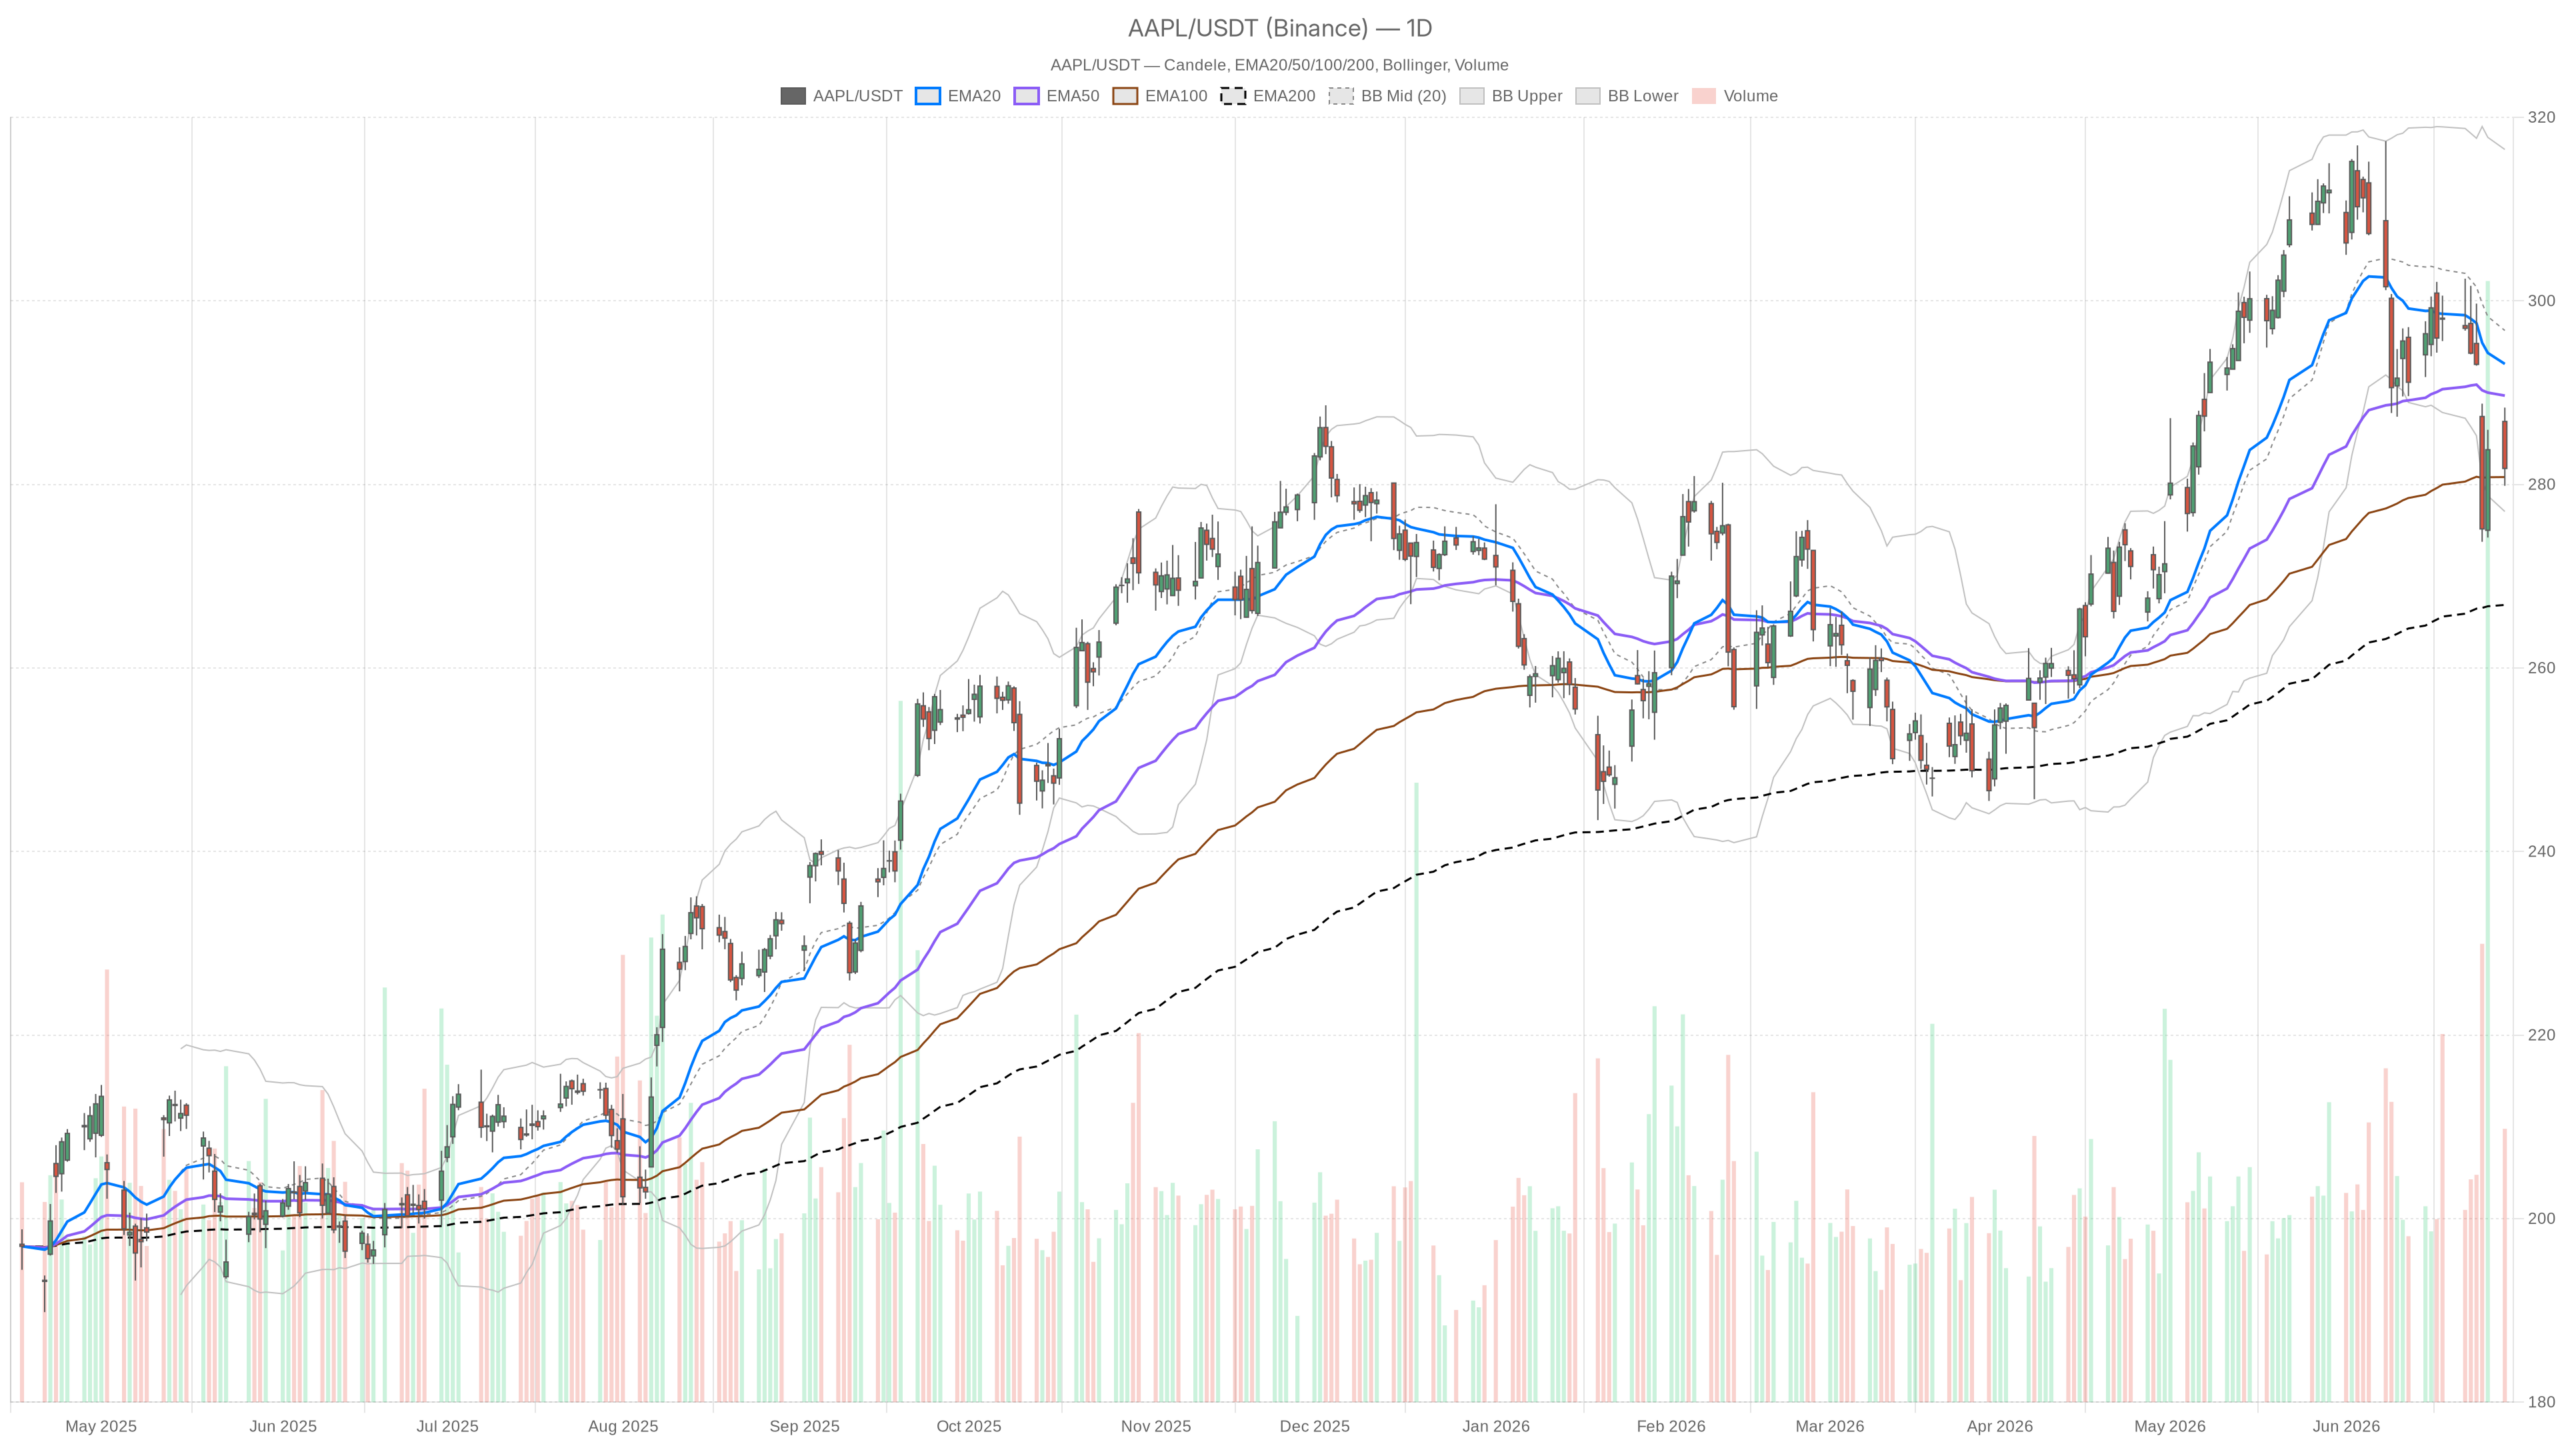
- AAPL closed at $281.74, below its 20-day EMA ($293.13) and 50-day EMA ($289.68), with the 200-day EMA at $266.87 as the long-term floor.
- The daily RSI at 39.9 signals entrenched bearish momentum without triggering oversold capitulation.
- Daily MACD shows a deepening divergence (line at -2.92, signal at -0.18, histogram at -2.74), arguing against a near-term reversal.
- Apple faces dual fundamental headwinds: price hike-driven demand concerns and regulatory uncertainty over CXMT chip sourcing.
- Elevated volatility with an $8.67 daily ATR demands cautious position sizing.
Apple Stock’s Daily Chart Confirms a Bearish Breakdown
The daily chart answers the trend question clearly: Apple Stock is in a sustained downtrend. Price sits beneath both the 20-day EMA and the 50-day EMA, which now act as overhead resistance rather than support.
Notably, AAPL closed at $281.74 on June 29. The 20-day EMA at $293.13 and the 50-day EMA at $289.68 both sit well above current price. This alignment places Apple Stock in a zone of persistent selling pressure. However, the 200-day EMA at $266.87 marks a longer-term floor. It sits far enough below to leave room for further downside before any structural support test.
The daily RSI at 39.9 is approaching oversold territory but has not yet reached it. This reading matters because it signals well-established bearish momentum. Crucially, it has not yet triggered the kind of capitulation that typically attracts contrarian buyers. In other words, there is still room to fall before technical exhaustion sets in.
Meanwhile, the daily MACD confirms the bearish regime without ambiguity. The MACD line sits at -2.92, already well below its signal line at -0.18. The histogram reads -2.74. This is not a nascent crossover. It is a divergence that has been building for some time. It argues strongly against any near-term trend reversal without a meaningful catalyst.
Volatility and Bollinger Bands Signal Distribution in Apple Stock
Moreover, Apple Stock is not simply declining. It is doing so within a distribution structure. The Bollinger Bands confirm this dynamic. Price is hugging the lower band under persistent selling pressure.
The Bollinger Bands midline sits at $296.77. Price closed near the lower band at $277.05. Under normal conditions, a tag of the lower band can suggest a bounce setup. However, when price hugs the band during a downtrend, it reflects distribution rather than accumulation. This is the current dynamic in Apple Stock.
In addition, the ATR of $8.67 reflects elevated daily volatility. Intraday swings are wide, meaning traders must size positions with that range in mind. The daily pivot point at $283.32 now acts as near-term resistance. R1 sits at $286.79. Support rests at $278.27, the daily S1 level. A break below that floor would shift focus toward the lower Bollinger Band and the $270 zone.
Hourly Chart Offers a Stabilization Nuance for Apple Stock
The hourly chart remains bearish but contains one subtle shift worth noting. Momentum is attempting to stabilize, even if the broader trend has not changed.
On the 1H timeframe, price at $281.63 sits below the EMA50 at $287.43. It also trades well below the EMA200 at $294.15. The only short-term average above current price is the 1H EMA20 at $282.38. Even that gap is marginal. The overall hourly EMA stack remains inverted. This formation typically reflects a market where rallies are sold rather than bought.
However, there is one nuance. The 1H MACD histogram has turned positive at +0.98, even as the MACD line remains negative at -2.16. This divergence between the histogram and the line suggests short-term momentum is attempting to stabilize. It is not a reversal signal. Still, it does indicate the pace of decline may be slowing temporarily. The 1H RSI at 45.04 is consistent with this view: weak, but not collapsing.
Apple Stock’s 15-Minute Chart Shows Consolidation, Not Reversal
The shortest timeframe adds no directional conviction. Apple Stock is compressing in a holding pattern, likely digesting the day’s losses before the next directional move.
Price hovers near $281.63. The EMA20 at $281.60 and the EMA50 at $281.50 sit nearly at current levels. The 15-minute MACD histogram has flatlined at zero. RSI at 51.4 is perfectly neutral.
In short, this is a market in short-term consolidation. For traders seeking entry context, the 15-minute setup offers no clear edge. It simply confirms that price has stalled. It has not reversed.
Fundamental Headwinds Weigh on Apple Stock
Turning to fundamentals, the picture is equally murky for Apple Stock. Two competing narratives are pulling in opposite directions. Neither offers the clean tailwind that would typically support a technical recovery.
Apple has reportedly raised prices on select products, citing a chip shortage driven by a DRAM supply squeeze. That decision has drawn skepticism from analysts. They warn that price hikes could decelerate revenue growth. This risk is especially acute in consumer hardware, where demand elasticity is a real constraint. At the same time, Apple is lobbying the Trump administration for approval to source memory chips from China’s CXMT. That firm is currently on the Pentagon’s blacklist. Loop Capital has reiterated a Buy rating, viewing the CXMT story as a potential supply solution. In contrast, others see the geopolitical risk as a complication rather than a resolution.
In sum, these two narratives pull in opposite directions. Price hikes pressure demand while chip sourcing creates regulatory uncertainty. Neither supports a clean fundamental recovery case for Apple Stock.
Apple Stock Scenarios: Bullish and Bearish Paths Forward
Looking ahead, two distinct paths define the outlook. The bearish case carries more weight, but a catalyst-driven bullish scenario also exists.
Bullish scenario: A resolution on the CXMT sourcing approval could provide a near-term catalyst. If Apple secures regulatory clearance, markets may interpret that as a supply chain fix. A relief rally toward the $286–$287 zone would then be plausible. That area clusters the EMA50 and R1 resistance. The hourly MACD histogram turning positive adds a small grain of technical support. For the bullish case to gain traction, AAPL would need to reclaim the $283.32 pivot. It must then hold that level as support on a closing basis.
Bearish scenario: On the other hand, if the CXMT approval stalls or is denied, selling pressure will likely resume. Further commentary around the revenue impact of price hikes would add fuel. A break below the $278.27 daily S1 support level opens the door toward the lower Bollinger Band at $277.05. A test of $270 over the coming sessions becomes possible. The daily MACD divergence and the RSI trajectory both support this as the higher-probability path absent a catalyst.
Overall, the weight of evidence across timeframes leans bearish for Apple Stock. The daily regime is deteriorating. Momentum has not bottomed. The fundamental news cycle is generating more uncertainty than clarity. The only offset is short-term stabilization visible on the hourly and 15-minute charts. This could produce a brief bounce rather than a sustained recovery. Positioning in Apple Stock here demands caution. Volatility remains elevated with an $8.67 daily ATR. The risk of sharp swings in either direction is very real. This is especially true on any headline from Washington regarding the CXMT decision.
FAQ
Is Apple Stock in a bearish trend?
Yes. Apple Stock trades below both its 20-day EMA ($293.13) and 50-day EMA ($289.68), with the daily RSI at 39.9 and a deeply negative MACD confirming sustained bearish momentum across the daily timeframe.
What are the key support levels for Apple Stock?
The nearest support is the daily S1 level at $278.27, followed by the lower Bollinger Band at $277.05. A break below these levels could open a path toward $270 and the 200-day EMA at $266.87.
What fundamental factors are pressuring Apple Stock?
Two main headwinds are at play: price hikes that may decelerate revenue growth in consumer hardware, and regulatory uncertainty surrounding Apple’s bid to source chips from China’s CXMT, a Pentagon-blacklisted firm.
Could Apple Stock stage a recovery soon?
A bullish scenario exists, but it requires a catalyst—most likely CXMT sourcing approval. If that materializes, a relief rally toward the $286–$287 resistance zone becomes plausible. Without it, the bearish path remains the higher-probability outcome.
Disclaimer: This article is for informational purposes only and does not constitute financial advice, an investment recommendation, or a solicitation to buy or sell any financial instrument or cryptocurrency. The analysis provided is not indicative of future results. Investing in crypto assets and financial markets carries a high risk of capital loss. Always do your own research (DYOR) and consult a qualified financial advisor before making any decision.
Article produced with the assistance of artificial intelligence and reviewed by the editorial team.