

Apple stock is under meaningful pressure, trading at $279.30 as of June 25. AAPL has broken decisively below its key daily moving averages and is now approaching critical support. The core question is whether this zone represents a genuine floor or merely a pause before deeper losses.
Summary
Key takeaways
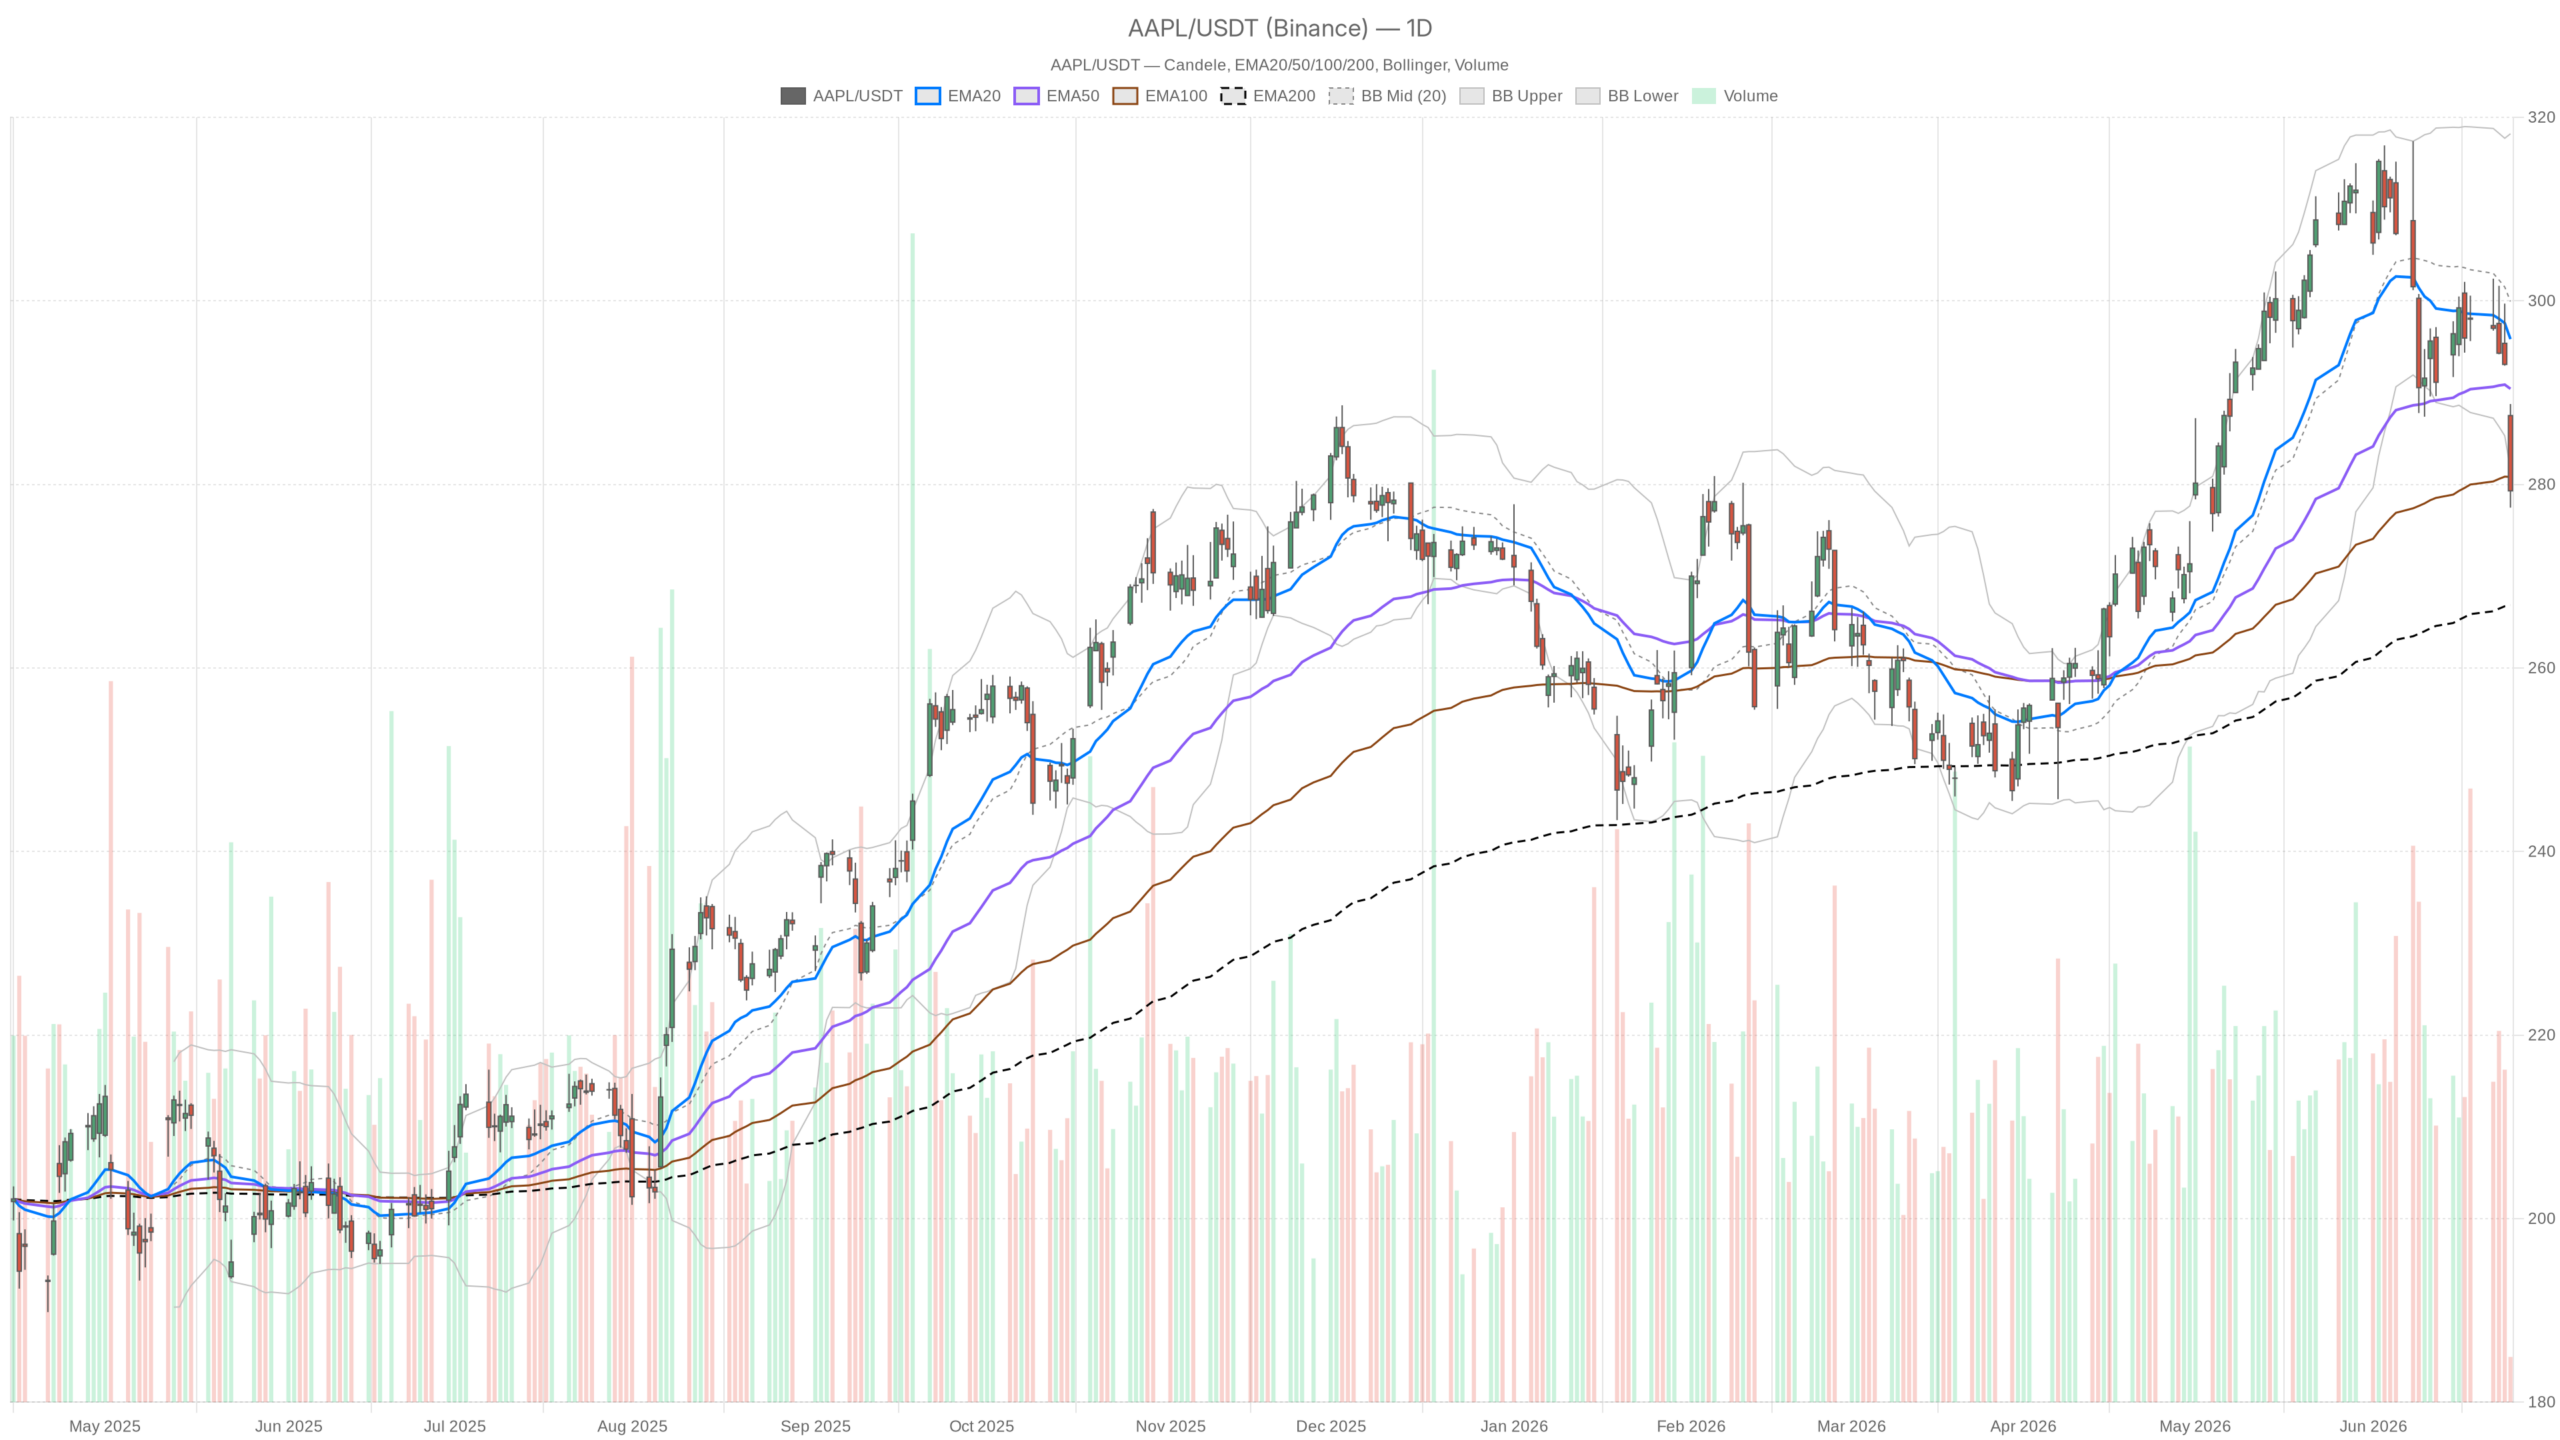
- Apple stock closed at $279.30 on June 25, below both its 20-day EMA ($295.83) and 50-day EMA ($290.42), a classically bearish configuration.
- The daily RSI at 34.58 is approaching oversold but hasn’t crossed 30, while the MACD histogram at -2.52 confirms widening bearish momentum.
- Hourly RSI has collapsed to 22.07, and the 15-minute RSI hit an extreme 17.61, signaling deeply oversold conditions across short-term timeframes.
- A daily close below S1 support at $274.93 would open the door toward the 200-day EMA near $266.85.
- Recovery above the daily pivot at $281.84 is the minimum requirement for bulls to regain any short-term footing.
Daily Timeframe: Apple Stock’s Bearish Structure Nears Critical Confluence
At the daily level, Apple stock confirms a broadly bearish structure. Price is now approaching a confluence of support levels that will likely define the near-term trajectory.
Moving Average Stack Confirms Bearish Control
On the daily chart, AAPL closed at $279.30, well below both its 20-day EMA at $295.83 and its 50-day EMA at $290.42. That stacking of price beneath both short- and medium-term trend lines is a classically bearish configuration. The 200-day EMA sits at $266.85 — a longer-term anchor well below current prices and still a potential magnet if selling accelerates.
Momentum Indicators Deepen the Concern
The daily RSI at 34.58 is approaching oversold territory but hasn’t quite crossed the 30 threshold. This suggests Apple stock is weak but not yet at a level historically associated with durable bottoming. Meanwhile, the daily MACD tells a sharper story: the line at -1.26 has crossed below the signal at 1.27, producing a histogram reading of -2.52. That negative and widening divergence confirms downward momentum is real and sustained.
Bollinger Band positioning adds further context. The daily lower band sits at $281.66, and AAPL closed just below that level. A close beneath the lower band often signals either an acceleration of the move or an exhaustion event. With the daily ATR at $8.69, single-session swings of that magnitude are entirely normal. The stock has room to probe lower without it being unusual.
Within this bearish configuration, the daily pivot point is $281.84, with S1 at $274.93 and R1 at $286.22. AAPL is currently trading below the pivot, putting it in structurally weak daily territory. A recovery above $281.84 would be the first minimal requirement for bulls to regain any short-term footing.
Hourly Timeframe: Bearish Momentum Intensifies for Apple Stock
The 1-hour chart intensifies the concern for Apple stock. Every signal on this timeframe points in the same direction — downside momentum is accelerating with no credible mean-reversion trigger yet in place.
Oversold RSI and Widening MACD Align Bearishly
The 1H RSI has collapsed to 22.07 — deeply into oversold territory and well below the 30 level that typically flags exhaustion. Under normal circumstances, a reading this low would invite contrarian attention. However, in a broader downtrend of this character, oversold can stay oversold for longer than most traders expect.
On the hourly chart, the MACD line at -3.03 is running well below its signal at -1.10, with a histogram of -1.93. The bearish divergence continues to widen on this timeframe. Price is also trading beneath all three hourly EMAs — the 20 at $293.73, the 50 at $296.14, and the 200 at $297.32. That full inversion of the EMA stack confirms the 1H regime is firmly bearish. No credible mean-reversion signal is in place yet.
Bollinger Breakdown Reinforces Directional Move
Notably, the 1H Bollinger Band lower boundary sits at $284.18, and price is already trading below that level. This reinforces the view that the current move is not a normal pullback within a healthy trend. It is a sustained directional breakdown. The hourly pivot at $279.28 aligns closely with the current price, making the $278.43–$279.30 zone a critical short-term battleground.
15-Minute Timeframe: Extreme Oversold Signals Flash on Apple Stock
The 15-minute chart provides execution context for Apple stock rather than trend decisions. Short-term exhaustion signals are now extreme, which could precede tactical bounces even within the broader downtrend.
The 15m RSI is at 17.61 — an extreme reading that rarely sustains for long. Short-term exhaustion at this level often precedes small technical bounces. The 15m MACD remains in negative territory, with the histogram at -1.60, but the divergence is not dramatically expanding.
In contrast to the broader sell-off, the 15m ATR at $2.39 shows that recent intraday volatility is modest relative to the daily range. This compression could indicate that selling is temporarily losing intensity. However, it does not constitute a reversal signal on its own. The 15m lower Bollinger Band at $275.32 marks the next near-term downside reference if the current congestion breaks lower.
Analyst Backdrop: Divided Views Create Uncertainty for Apple Stock
The technical weakness in Apple stock does not exist in a vacuum. Analyst opinions are sharply divided, reflecting genuine uncertainty about the company’s near-term fundamentals.
UBS maintained a neutral rating on AAPL on June 25, citing ongoing iPhone weakness in China as a structural headwind. That view aligns with the current price action — a stock struggling to find buyers, not just hitting a temporary air pocket.
On the other hand, BofA Securities reiterated its Buy rating and a $380 price target as recently as June 22. The firm views Apple’s updated Siri strategy and WWDC announcements as a material positive for the company’s AI positioning. CEO Tim Cook has also confirmed price increases to offset rising memory costs — a move BofA believes will protect margins. That $380 target implies substantial upside from current levels. Still, the gap between analyst optimism and price reality is currently very wide.
Meanwhile, separate commentary suggests that Apple’s AI upgrade cycle may not be the demand catalyst that bulls are counting on. Questions around whether the refreshed Siri meaningfully expands iPhone market share remain open. The market appears to be pricing in skepticism rather than conviction on that front.
Bullish Scenario: What Apple Stock Needs to Reverse
For Apple stock to mount a credible recovery, more than an oversold bounce is required. The technical thresholds are clear and measurable, and they start with reclaiming lost ground on the daily chart.
A credible bull case requires more than a bounce off oversold indicators. For the broader trend to stabilize and potentially reverse, AAPL would need to reclaim the daily pivot at $281.84 on a closing basis. Beyond that, a sustained recovery above the lower Bollinger Band at $281.66 is needed. Reclaiming the 50-day EMA at $290.42 would then be necessary to argue that sellers have lost control.
If BofA’s thesis proves correct — price increases holding margins and the Siri overhaul gaining traction — the current zone near $279 could eventually look like a compelling accumulation level. That assessment is relative to the firm’s $380 target. The 200-day EMA at $266.85 would also provide a significant backstop if the stock slides further before recovering.
Bearish Scenario: The Path of Least Resistance
The bear case remains the path of least resistance for Apple stock right now. Key support levels below current price are clearly defined, and the technical evidence does not yet suggest selling exhaustion.
In this context, a daily close below the daily S1 support at $274.93 would open the door toward the $266–$268 zone where the 200-day EMA resides. China iPhone weakness — flagged explicitly by UBS — is a tangible fundamental drag. If that narrative deepens, technical support levels alone will not hold.
Furthermore, the daily MACD histogram is still widening to the downside. The daily RSI has not yet entered true oversold territory on the primary timeframe. There is no technical evidence that selling has exhausted itself. The stock is beneath all meaningful daily EMAs with no credible base forming. That is a difficult environment for recovery attempts to hold.
Apple Stock Positioning and Volatility Outlook
Overall, Apple stock presents a challenging picture for near-term positioning. The daily bias is bearish, the hourly confirms it, and short-term momentum is deeply stretched. A tactical bounce is plausible given how extreme the 15m and 1H RSI readings are. However, any bounce into the $281–$286 zone should be evaluated against the broader downtrend. It should not be treated as a trend reversal.
At the same time, the daily ATR of $8.69 means the stock can move sharply in either direction within a single session. Volatility remains elevated relative to the tight intraday range seen in recent hours. This suggests that the next directional move could be significant. Until AAPL reclaims its key moving averages and daily pivot with conviction, the technical weight of evidence favors caution over optimism.
FAQ
What is the key support level for Apple stock right now?
The most immediate support is the daily S1 pivot at $274.93. Below that, the 200-day EMA at $266.85 represents a longer-term anchor. A daily close below $274.93 would open the door toward the $266–$268 zone.
Is Apple stock oversold enough for a tactical bounce?
Short-term timeframes show extreme oversold readings — the hourly RSI at 22.07 and the 15-minute RSI at 17.61. These levels often precede small technical bounces. However, on the primary daily timeframe, the RSI at 34.58 has not yet entered true oversold territory, meaning the broader trend has not reached exhaustion.
What would signal a trend reversal for AAPL?
A trend reversal would require AAPL to reclaim the daily pivot at $281.84 on a closing basis, followed by a sustained recovery above the 50-day EMA at $290.42. Until both levels are retaken with conviction, the technical structure remains bearish.
Why is Apple stock under pressure despite strong analyst ratings?
While BofA maintains a Buy rating with a $380 target, UBS has flagged ongoing iPhone weakness in China as a structural headwind. The market currently appears to be pricing in skepticism about the AI upgrade cycle rather than the optimism reflected in bullish analyst targets.
Disclaimer: This article is for informational purposes only and does not constitute financial advice, an investment recommendation, or a solicitation to buy or sell any financial instrument or cryptocurrency. The analysis provided is not indicative of future results. Investing in crypto assets and financial markets carries a high risk of capital loss. Always do your own research (DYOR) and consult a qualified financial advisor before making any decision.
Article produced with the assistance of artificial intelligence and reviewed by the editorial team.