

Netflix stock is in freefall. Trading at $71.84, NFLX just hit a fresh 52-week low — nearly 32% off highs — sitting below every major moving average. Yet oversold signals are flashing inside the wreckage. The question: has the selling exhausted itself or merely paused?
Summary
Key takeaways
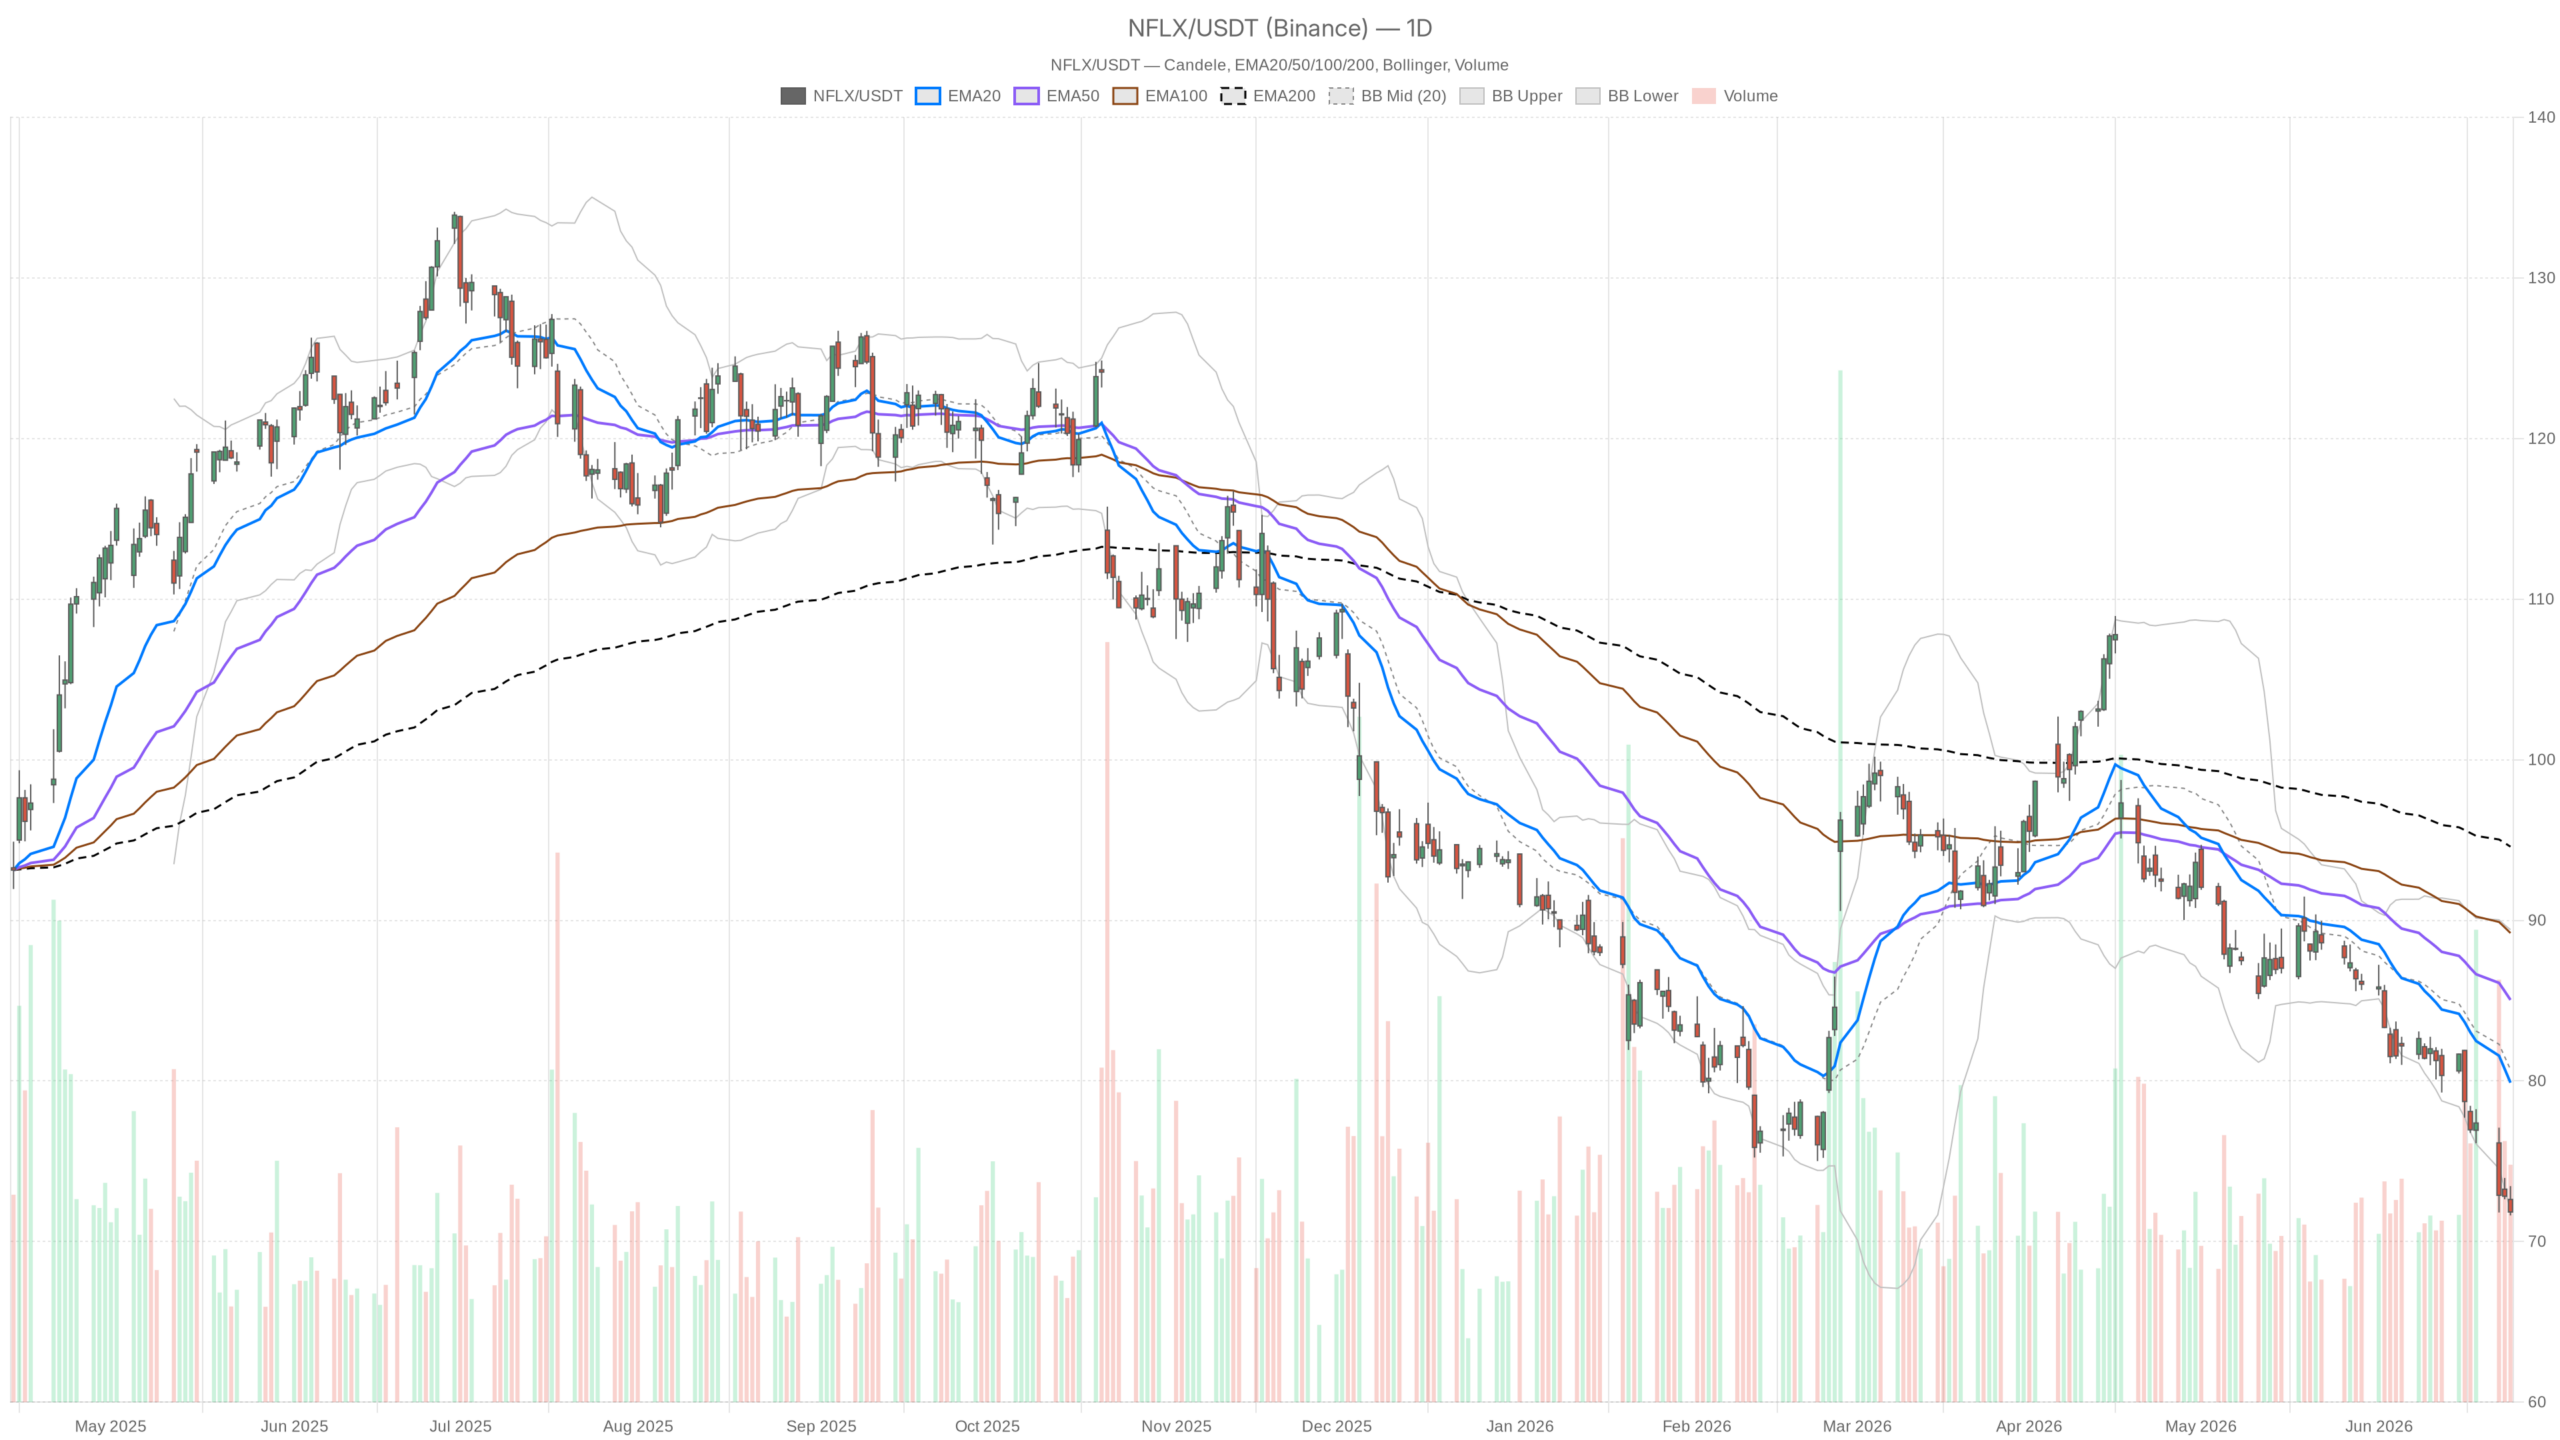
- Netflix stock closed at $71.84, tagging a fresh 52-week low and trading below all major daily moving averages.
- The daily RSI dropped to 20.15, a deeply oversold level that historically marks zones where short-entry risk-reward deteriorates sharply.
- Price sits below the lower daily Bollinger Band at $71.99, confirming statistically extreme negative territory.
- The hourly MACD histogram turned fractionally positive at +0.13, hinting at fading short-term selling momentum.
- A daily close below $71.16 (S1 pivot) would likely extend the breakdown toward the $68–$69 area.
Daily Timeframe Breakdown
Netflix stock is technically broken on the daily chart. Price closed below the lower Bollinger Band, confirming statistically extreme negative territory with no nearby dynamic support.
The daily timeframe sets the tone, and it is unambiguously bearish. Price closed at $71.84, below the lower Bollinger Band at $71.99. Every layer of the EMA stack confirms the broader damage. The 20-day EMA sits at $79.89, the 50-day at $85.04, and the 200-day at $94.59. Price trades beneath all three, facing a wall of overhead resistance.
Oversold Momentum Signals
However, the daily RSI at 20.15 is the most striking data point on the chart. That reading is deeply oversold by any reasonable measure. Markets can remain oversold longer than traders expect. Still, an RSI this low historically marks zones where the risk-reward for fresh short entries deteriorates sharply.
Meanwhile, the daily MACD reinforces the bearish regime. The line is at -3.88 versus a signal of -3.11, with a histogram of -0.77. The widening negative histogram also signals that momentum may be reaching a near-term extreme, even as the broader trend stays firmly negative.
Volatility and Pivot Context
Daily ATR sits at $2.29, confirming elevated volatility relative to recent sessions. That magnitude of daily range matters for positioning. Traders cannot treat this as a low-risk environment, even those considering a mean-reversion entry.
Daily pivot analysis places the pivot point at $72.30, R1 at $72.98, and S1 at $71.16. The close below the pivot, combined with proximity to the lower Bollinger Band, keeps technical pressure firmly to the downside on the daily frame.
Hourly Chart Signals
The hourly chart remains bearish but shows a modest internal shift. The MACD histogram has turned fractionally positive, hinting at fading selling momentum within the session without yet confirming a reversal.
On the hourly chart, price closed at $71.83 in the 15:30 session. The hourly RSI sits at 30.07 — deeply oversold but not yet confirmed as a reversal signal. Notably, the hourly MACD histogram has turned fractionally positive at +0.13. This suggests short-term selling momentum is fading at the margin.
It is not a bullish signal in isolation. However, it does indicate the rate of decline may be slowing within the session. The hourly EMA structure mirrors the daily deterioration. The 20-hour EMA is at $73.23, the 50-hour at $75.61, and the 200-hour at $81.80. Price trades beneath all three.
Still, the hourly Bollinger Bands show the lower band at $71.74, which price is pressing against. This extreme reading historically invites at least a short-term relief bounce, even within broader downtrends. Hourly ATR of $0.63 points to contained intrabar volatility, consistent with a consolidation phase rather than outright capitulation.
Short-Term Execution Context
The 15-minute chart shows very short-term stabilization. The MACD histogram is marginally positive and the RSI is recovering from deeper oversold levels, but no confirmed directional shift has emerged.
At the 15-minute level, the execution context is equally compressed. Price is wedged near the pivot point of $71.99, with R1 at $72.23 and S1 at $71.59 forming a tight corridor. The 15-minute MACD histogram is marginally positive at +0.02. The RSI at 38.59 is recovering from deeper oversold territory.
This points to near-term stabilization rather than a confirmed reversal. The 15-minute EMA structure remains fully bearish, with price below all three moving averages. Traders should treat this as a pause, not a reversal base.
Fundamental Backdrop
The fundamental narrative adds texture to Netflix stock’s technical breakdown. A leadership transition and broader rotation out of growth names are weighing on sentiment, even as value-oriented arguments begin to surface.
NFLX hit its 52-week low alongside a broader rotation out of growth names and into chipmakers. The stock is down 32% since founder Reed Hastings stepped down — a leadership transition the market has clearly not digested positively.
Meanwhile, several analysts and financial media outlets have begun framing the current price as a potential long-term buying opportunity. They cite 20–22x earnings multiples and expanding ad-tier revenue as structural supports through 2030. That sentiment shift is worth noting. However, it remains a fundamental argument in a technically broken chart.
Bullish Scenario for Netflix Stock
The bullish case for Netflix stock depends on capitulation exhaustion and fundamental re-rating. Price must reclaim the $72.30 pivot and close above the $73–$74 zone to open a path toward $78–$80.
The bullish scenario rests on a combination of capitulation exhaustion and fundamental re-rating. If the daily RSI sustains a recovery from sub-20 levels and price reclaims the $72.30 pivot, a relief rally becomes plausible. A close above the $73–$74 zone would open the path back toward $78–$80.
The hourly MACD histogram turning sustainably green is a necessary confirmation. A catalyst — such as a positive earnings revision or subscriber growth update — would significantly accelerate any recovery. In this scenario, oversold mean-reversion buyers gradually absorb sell pressure near the lower Bollinger Band.
Bearish Scenario for Netflix Stock
The bearish scenario remains the higher-probability path under current structure. A daily close below S1 pivot support at $71.16 would likely extend the breakdown toward $68–$69 with limited technical footing.
In contrast, the bearish scenario remains the higher-probability path. A daily close below $71.16 — the S1 pivot support — would extend the breakdown. Limited technical footing exists until the $68–$69 area. The daily MACD is still diverging negatively, and no trend reversal pattern has formed on any timeframe.
Furthermore, if broader market rotation continues to punish growth stocks, NFLX has little in its chart to arrest the slide mechanically. Fresh 52-week lows also tend to generate further momentum selling as stop-loss clusters trigger, compounding the downside pressure.
Overall Technical Verdict
Netflix stock is technically broken on every meaningful timeframe. The bearish regime is uncontested, yet the depth of oversold conditions demands careful risk management on both sides of the trade.
Overall, Netflix stock is technically broken on every meaningful timeframe. The bearish regime is uncontested. Yet the depth of the oversold condition — particularly the daily RSI below 20 — creates a zone where the risk of being aggressively short must be weighed carefully.
This is a market defined by elevated volatility, extreme selling pressure, and an emerging narrative debate. Fundamental value buyers and technically driven sellers are locked in a tug-of-war. Neither side has won. Until price reclaims at least the daily pivot and the hourly EMA structure begins to flatten, the path of least resistance remains down. Any positioning in either direction demands strict risk discipline.
FAQ
Is Netflix stock oversold enough to buy right now?
The daily RSI at 20.15 is deeply oversold, which historically marks zones where short-entry risk-reward deteriorates. However, no reversal pattern has formed on any timeframe. The bearish regime remains uncontested, meaning aggressive buying without confirmation carries significant risk.
What is the next key support level for NFLX?
The immediate support is the daily S1 pivot at $71.16. A close below that level would open the path toward the $68–$69 area, where the next meaningful technical footing may emerge. Until then, the lower Bollinger Band near $71.99 is being tested as a potential floor.
What would confirm a trend reversal for Netflix stock?
A confirmed reversal would require price to reclaim the daily pivot at $72.30, close above the $73–$74 zone, and see the hourly EMA structure begin to flatten. The hourly MACD histogram turning sustainably positive is a necessary early confirmation signal.
Why did Netflix stock drop to a 52-week low?
The decline reflects a combination of factors: a broader rotation out of growth stocks into chipmakers, a 32% drawdown since founder Reed Hastings stepped down, and sustained technical selling pressure that has pushed price below all major moving averages on the daily chart.
Disclaimer: This article is for informational purposes only and does not constitute financial advice, an investment recommendation, or a solicitation to buy or sell any financial instrument or cryptocurrency. The analysis provided is not indicative of future results. Investing in crypto assets and financial markets carries a high risk of capital loss. Always do your own research (DYOR) and consult a qualified financial advisor before making any decision.
Article produced with the assistance of artificial intelligence and reviewed by the editorial team.