




Summary
Intuitive Surgical, Inc. Stock Remains Under Pressure After Earnings Sell-Off
Intuitive Surgical, Inc. stock closed at $402.33 on July 16, 2026, tumbling 9% after beating Q2 estimates by $0.29. Selling the news on strong results confirms investor sentiment has already shifted bearish.
Key takeaways
- ISRG closed at $402.33 on July 16, 2026, down 9% post-earnings despite beating Q2 EPS by $0.29.
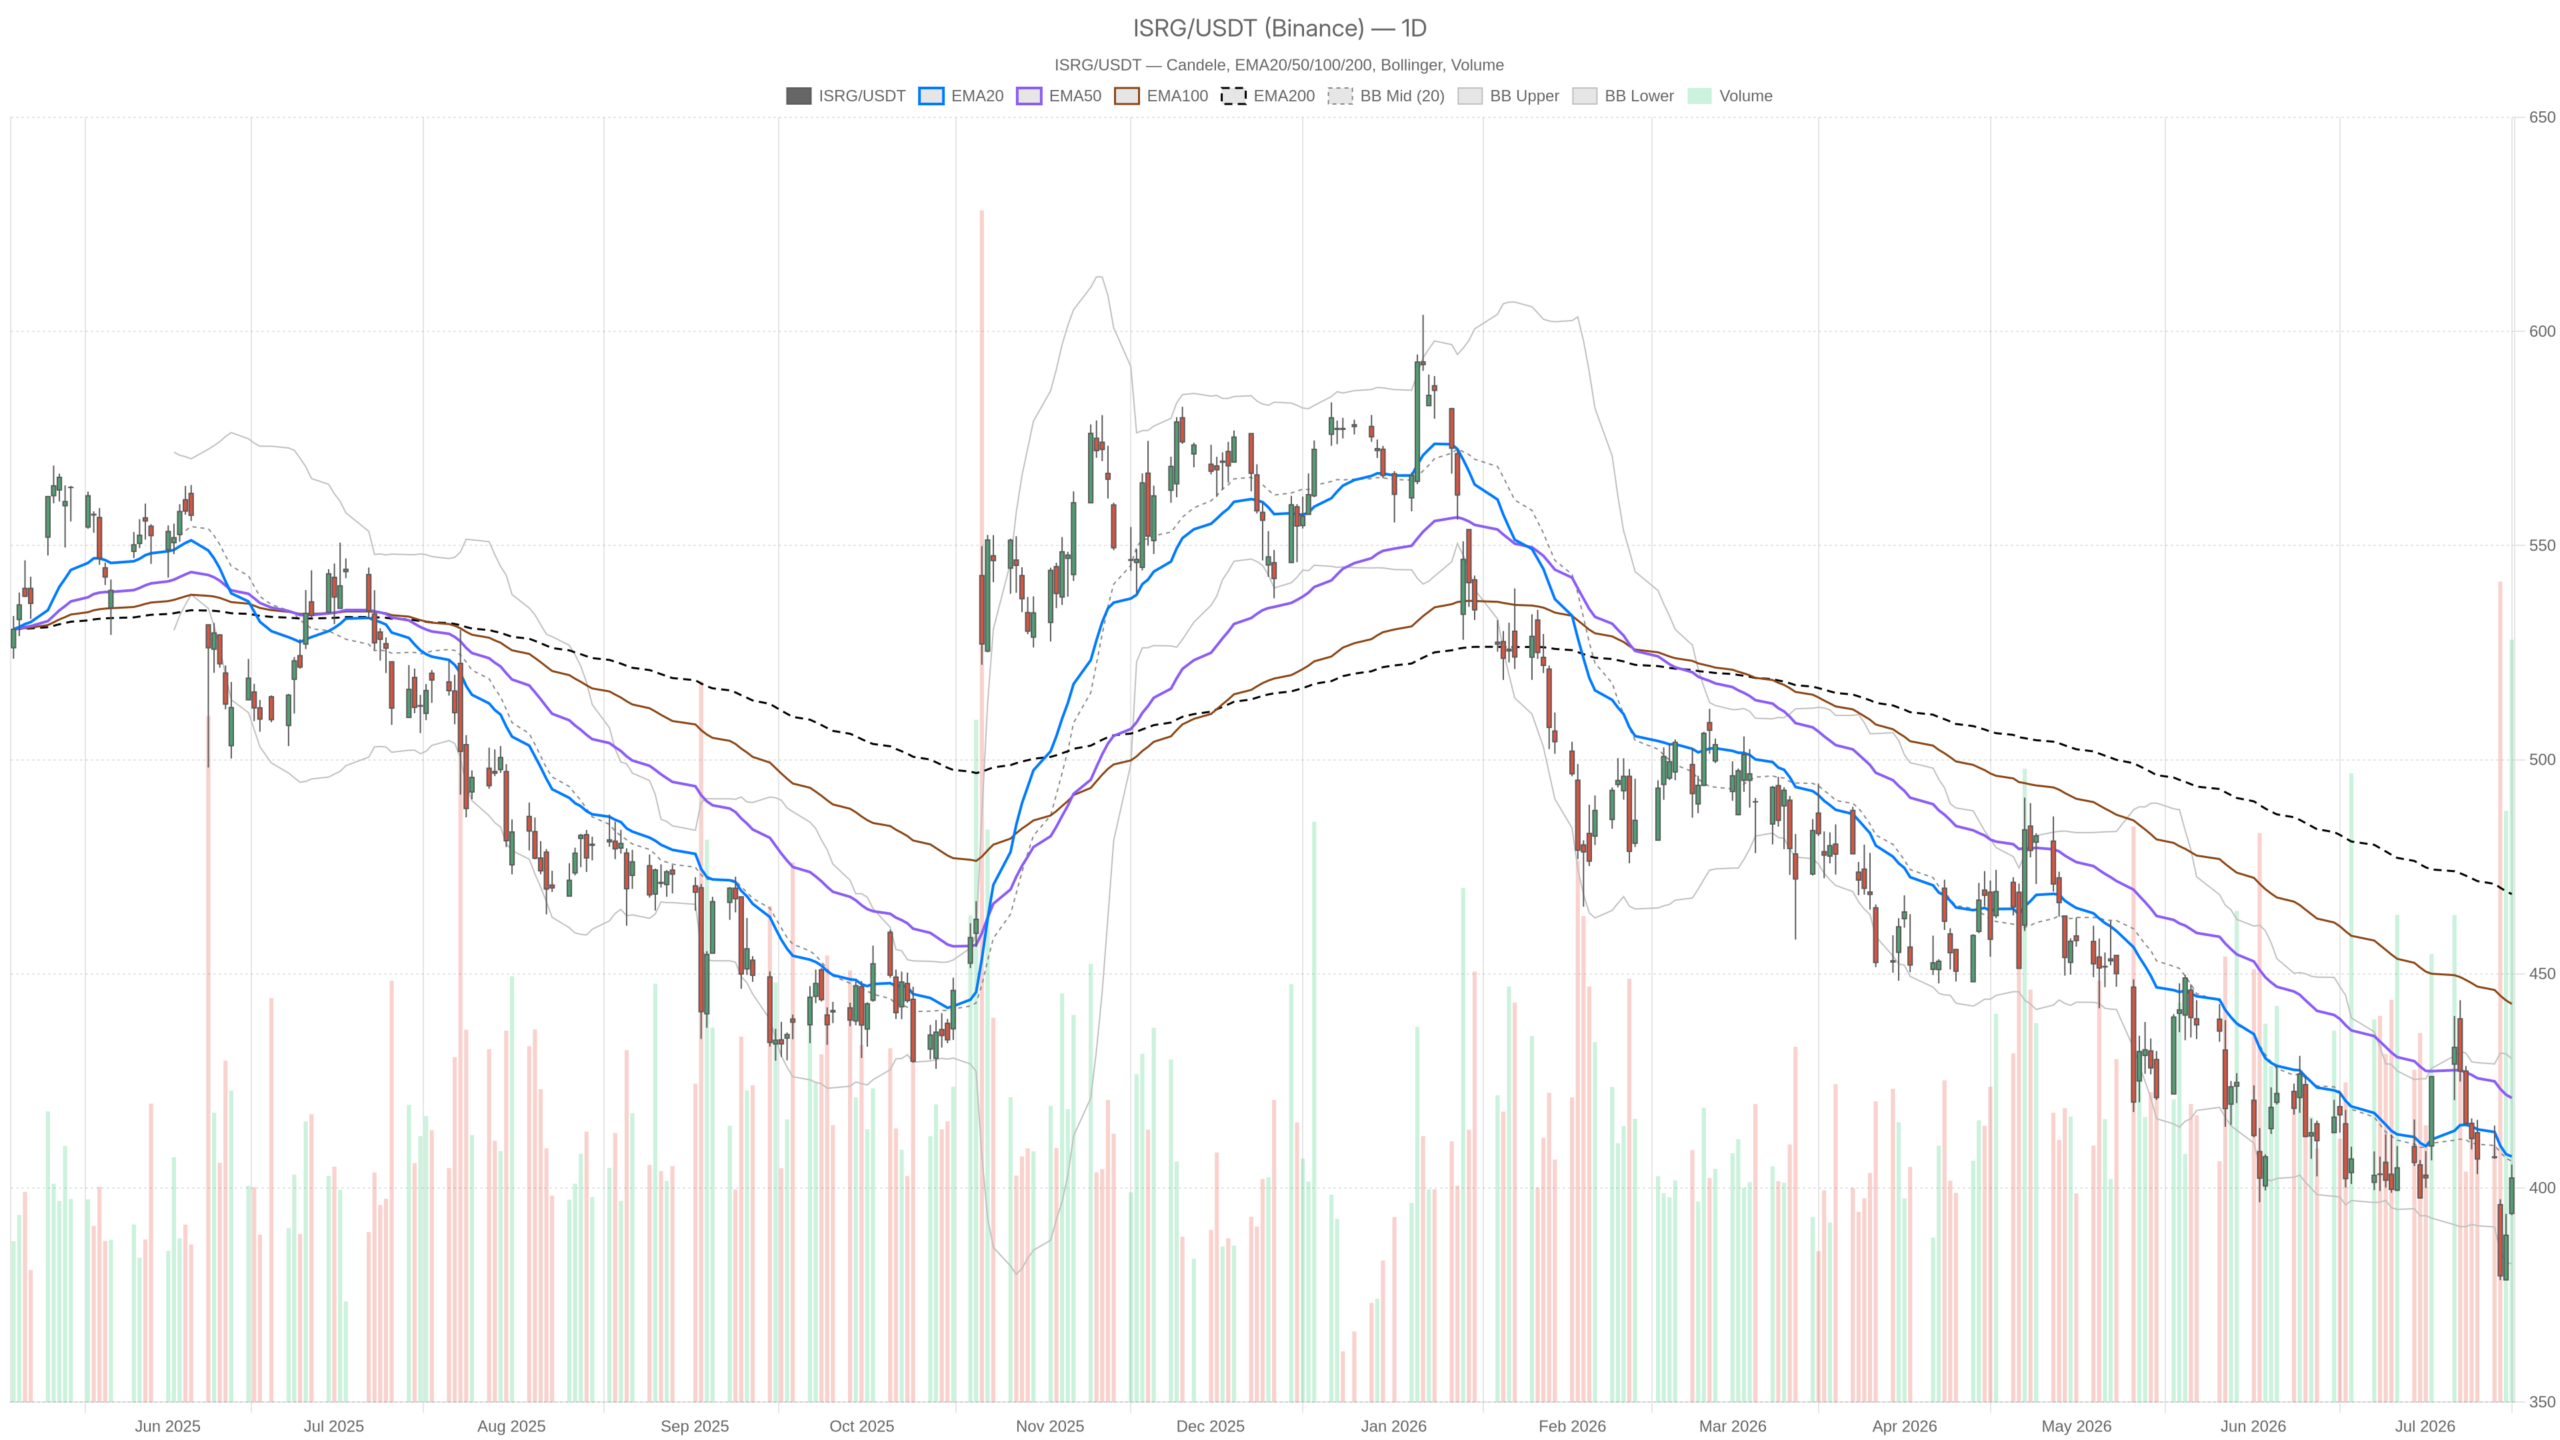
- The stock trades below the 20-day, 50-day, and 200-day EMAs, confirming a sustained daily downtrend.
- Daily MACD is expanding negatively with a histogram at -1.08 and RSI at 46.28, below the neutral 50 level.
- A Class II worldwide recall of da Vinci system components in April 2026 adds fundamental pressure.
- Key resistance sits at $406–$410; failure to hold above the daily pivot at $400.49 opens the door toward $395.51 and $382.29.
Daily Bias — Bearish Regime Below All Key EMAs
Intuitive Surgical, Inc. stock is in a confirmed daily downtrend. Price sits below all three key exponential moving averages. The 20-day EMA at $407.36, the 50-day EMA at $421.02, and the 200-day EMA at $468.63 all slope downward above current price. This full EMA stack alignment signals a sustained bearish regime, not a consolidation.
Momentum Indicators Show Expanding Weakness
The daily RSI at 46.28 sits just below the neutral 50 level. It is not oversold. This means no technical floor is forming from exhaustion. In fact, momentum has room to deteriorate further before reaching a capitulation zone. Meanwhile, the daily MACD reinforces this picture. The line sits at -5.82 against a signal of -4.74. The histogram stands at -1.08. Bearish momentum is not only present — it is still expanding to the downside.
Meanwhile, Bollinger Bands on the daily chart place the midline at $406.24. Price currently trades below it. The lower band rests at $382.29. That represents the next significant technical reference if sellers maintain control. The ATR of $14.73 reflects meaningful daily volatility. Moves of that magnitude are entirely normal in this environment. This makes precise entries and risk management critical.
Notably, daily pivot analysis supports a cautious read. The pivot point sits at $400.49, with R1 at $407.32 and S1 at $395.51. Price is marginally above the pivot. However, the post-earnings selling pressure makes $407 resistance a formidable ceiling in the near term.
The da Vinci Recall Adds Fundamental Weight to the Technical Weakness
Beyond the charts, a key fundamental risk compounds the technical damage. In April 2026, Intuitive Surgical voluntarily initiated a Class II worldwide recall of certain da Vinci surgical system components. The issue — an E-brake retainer pin problem — could impede emergency braking or cause uncontrolled column motion. It affected 454 identified units. That kind of regulatory event rarely resolves cleanly in the short term. It introduces operational uncertainty around the flagship product line, even if the recall was voluntary.
Notably, the stock was already down 6.3% when the recall news circulated more broadly. Combined with the post-earnings drop of 9%, these are not minor corrections. They reflect a market reassessing the risk premium on Intuitive Surgical, Inc. stock at its current valuation level.
Hourly Timeframe — A Temporary Counter-Trend Recovery
However, the hourly picture offers nuance without overturning the daily bearish bias. The 1H regime is classified as neutral. Still, it is better interpreted as short-term stabilization within a downtrend rather than a genuine trend reversal.
The 1H RSI at 58.09 pushes above 50 and toward the upper half of its range. This reflects a local bounce in progress. Notably, the hourly MACD histogram at +2.21 — with the MACD line crossing above its signal — supports this short-term upside momentum. Price at $402.33 now trades above the 1H EMA20 at $396.59 and the EMA50 at $401.16. It remains below the EMA200 at $410.13.
In other words, buyers are re-engaging after the earnings-day crash. However, they are doing so against the grain of the daily trend. The 1H Bollinger upper band at $406.27 aligns closely with the daily R1 at $407.32. That confluence zone will be the first real test of whether this bounce has conviction behind it.
15-Minute Execution Context — Approaching Short-Term Resistance
The 15-minute chart shows price pressing against short-term resistance. The RSI sits at 65.04 — elevated and approaching overbought territory for this timeframe. At the same time, the 15m MACD histogram has ticked slightly negative at -0.11. This suggests the near-term momentum is beginning to stall. The 15m Bollinger upper band sits at $402.23, meaning price is essentially pressing against the top of the short-term range.
The 15m pivot R1 at $403.84 represents the immediate overhead barrier. For short-term timing, the setup does not favor aggressive long entries at this level. The intraday bounce looks extended on the 15-minute frame even as the hourly remains constructive.
Bullish Scenario — What Would Need to Change
A genuine bullish reversal would require more than a one-day bounce. For the daily bearish regime to credibly shift, Intuitive Surgical, Inc. stock would need to reclaim the EMA20 at $407.36 on a closing basis. It would then need to challenge the Bollinger midline at $406.24. A sustained move above $410 — the 1H EMA200 — would offer the first real structural evidence that selling pressure is abating.
On the fundamental side, further clarity around the da Vinci recall resolution could help. Combined with management commentary reinforcing the procedure growth trajectory, this could restore institutional confidence. If the Q2 beat is eventually seen as the more important data point, a revaluation higher is plausible.
Bearish Scenario — The Path of Least Resistance
On the other hand, the bearish case remains the dominant one given current structure. A failure to hold above the daily pivot at $400.49 would open the door toward S1 at $395.51. Below that, the daily Bollinger lower band at $382.29 becomes the logical next target. Given the ATR of nearly $15, that distance could be covered quickly in a risk-off session.
Therefore, the broader concern is the EMA stack combined with an expanding negative MACD. Price below all three key moving averages on the daily chart suggests the path of least resistance remains lower. Selling the bounce near $406–$407 aligns with the daily regime as long as that resistance holds.
Positioning in a High-Volatility Conflicted Environment
Overall, Intuitive Surgical, Inc. stock presents a classic timeframe conflict. A bearish daily structure is interrupted by a short-term hourly recovery. The daily evidence dominates. The fundamentals — recall risk, post-earnings selling, and elevated valuation questions — reinforce the bearish bias. The intraday bounce has brought price to a critical resistance confluence between $406 and $410.
Ultimately, how price behaves at that zone will set the tone for the days ahead. Volatility remains elevated, uncertainty is genuine, and the risk-reward calculus does not yet favor directional commitment in either direction. Price must resolve against one of these structural levels first.
FAQ
Why did Intuitive Surgical stock drop after beating Q2 earnings?
Despite beating Q2 estimates by $0.29 per share, Intuitive Surgical, Inc. stock fell 9% as the market focused on broader concerns. These include the April 2026 Class II da Vinci recall affecting 454 units and questions about valuation. The sell-off signals that investor sentiment had already turned cautious before the earnings release.
What are the key resistance levels for ISRG?
The critical resistance zone lies between $406 and $410. This includes the daily R1 at $407.32, the 20-day EMA at $407.36, the daily Bollinger midline at $406.24, and the 1H EMA200 at $410.13. A sustained move above $410 would be the first structural evidence of a potential trend shift.
What is the bearish target for Intuitive Surgical stock?
If ISRG fails to hold above the daily pivot at $400.49, the next support sits at S1 — $395.51. Below that, the daily Bollinger lower band at $382.29 becomes the logical target. With an ATR of $14.73, that distance could be covered in a single risk-off session.
How does the da Vinci recall affect Intuitive Surgical’s stock outlook?
The April 2026 Class II worldwide recall of da Vinci system components introduced operational uncertainty around the flagship product line. Although voluntary, the recall involving an E-brake retainer pin problem across 454 units adds fundamental weight to the already bearish technical structure of Intuitive Surgical, Inc. stock.
Disclaimer: This article is for informational purposes only and does not constitute financial advice, an investment recommendation, or a solicitation to buy or sell any financial instrument or cryptocurrency. The analysis provided is not indicative of future results. Investing in crypto assets and financial markets carries a high risk of capital loss. Always do your own research (DYOR) and consult a qualified financial advisor before making any decision.
Article produced with the assistance of artificial intelligence and reviewed by the editorial team.
