



ASML Holding N.V. New York Re stock faces a defining tension. The Dutch semiconductor giant beat Q2 earnings on July 15, raised full-year guidance, and posted net profits of 2.9 billion euros. Yet the technical chart remains stubbornly neutral — a disconnect between catalyst and price structure.
Summary
Key takeaways
- ASML beat Q2 earnings with net profits of 2.9 billion euros, up from 2.3 billion in the same period of 2025.
- Daily RSI at 50.05 and price pinned below the EMA20 at 1,790.24 confirm a neutral technical bias.
- The daily MACD histogram at -20.06 warns of fading momentum despite the fundamental beat.
- Bullish trigger: a daily close above the 1,790–1,800 resistance zone.
- Bearish trigger: failure to hold the 1,750 support level.
ASML Daily Bias: Neutral Ground, Not Conviction
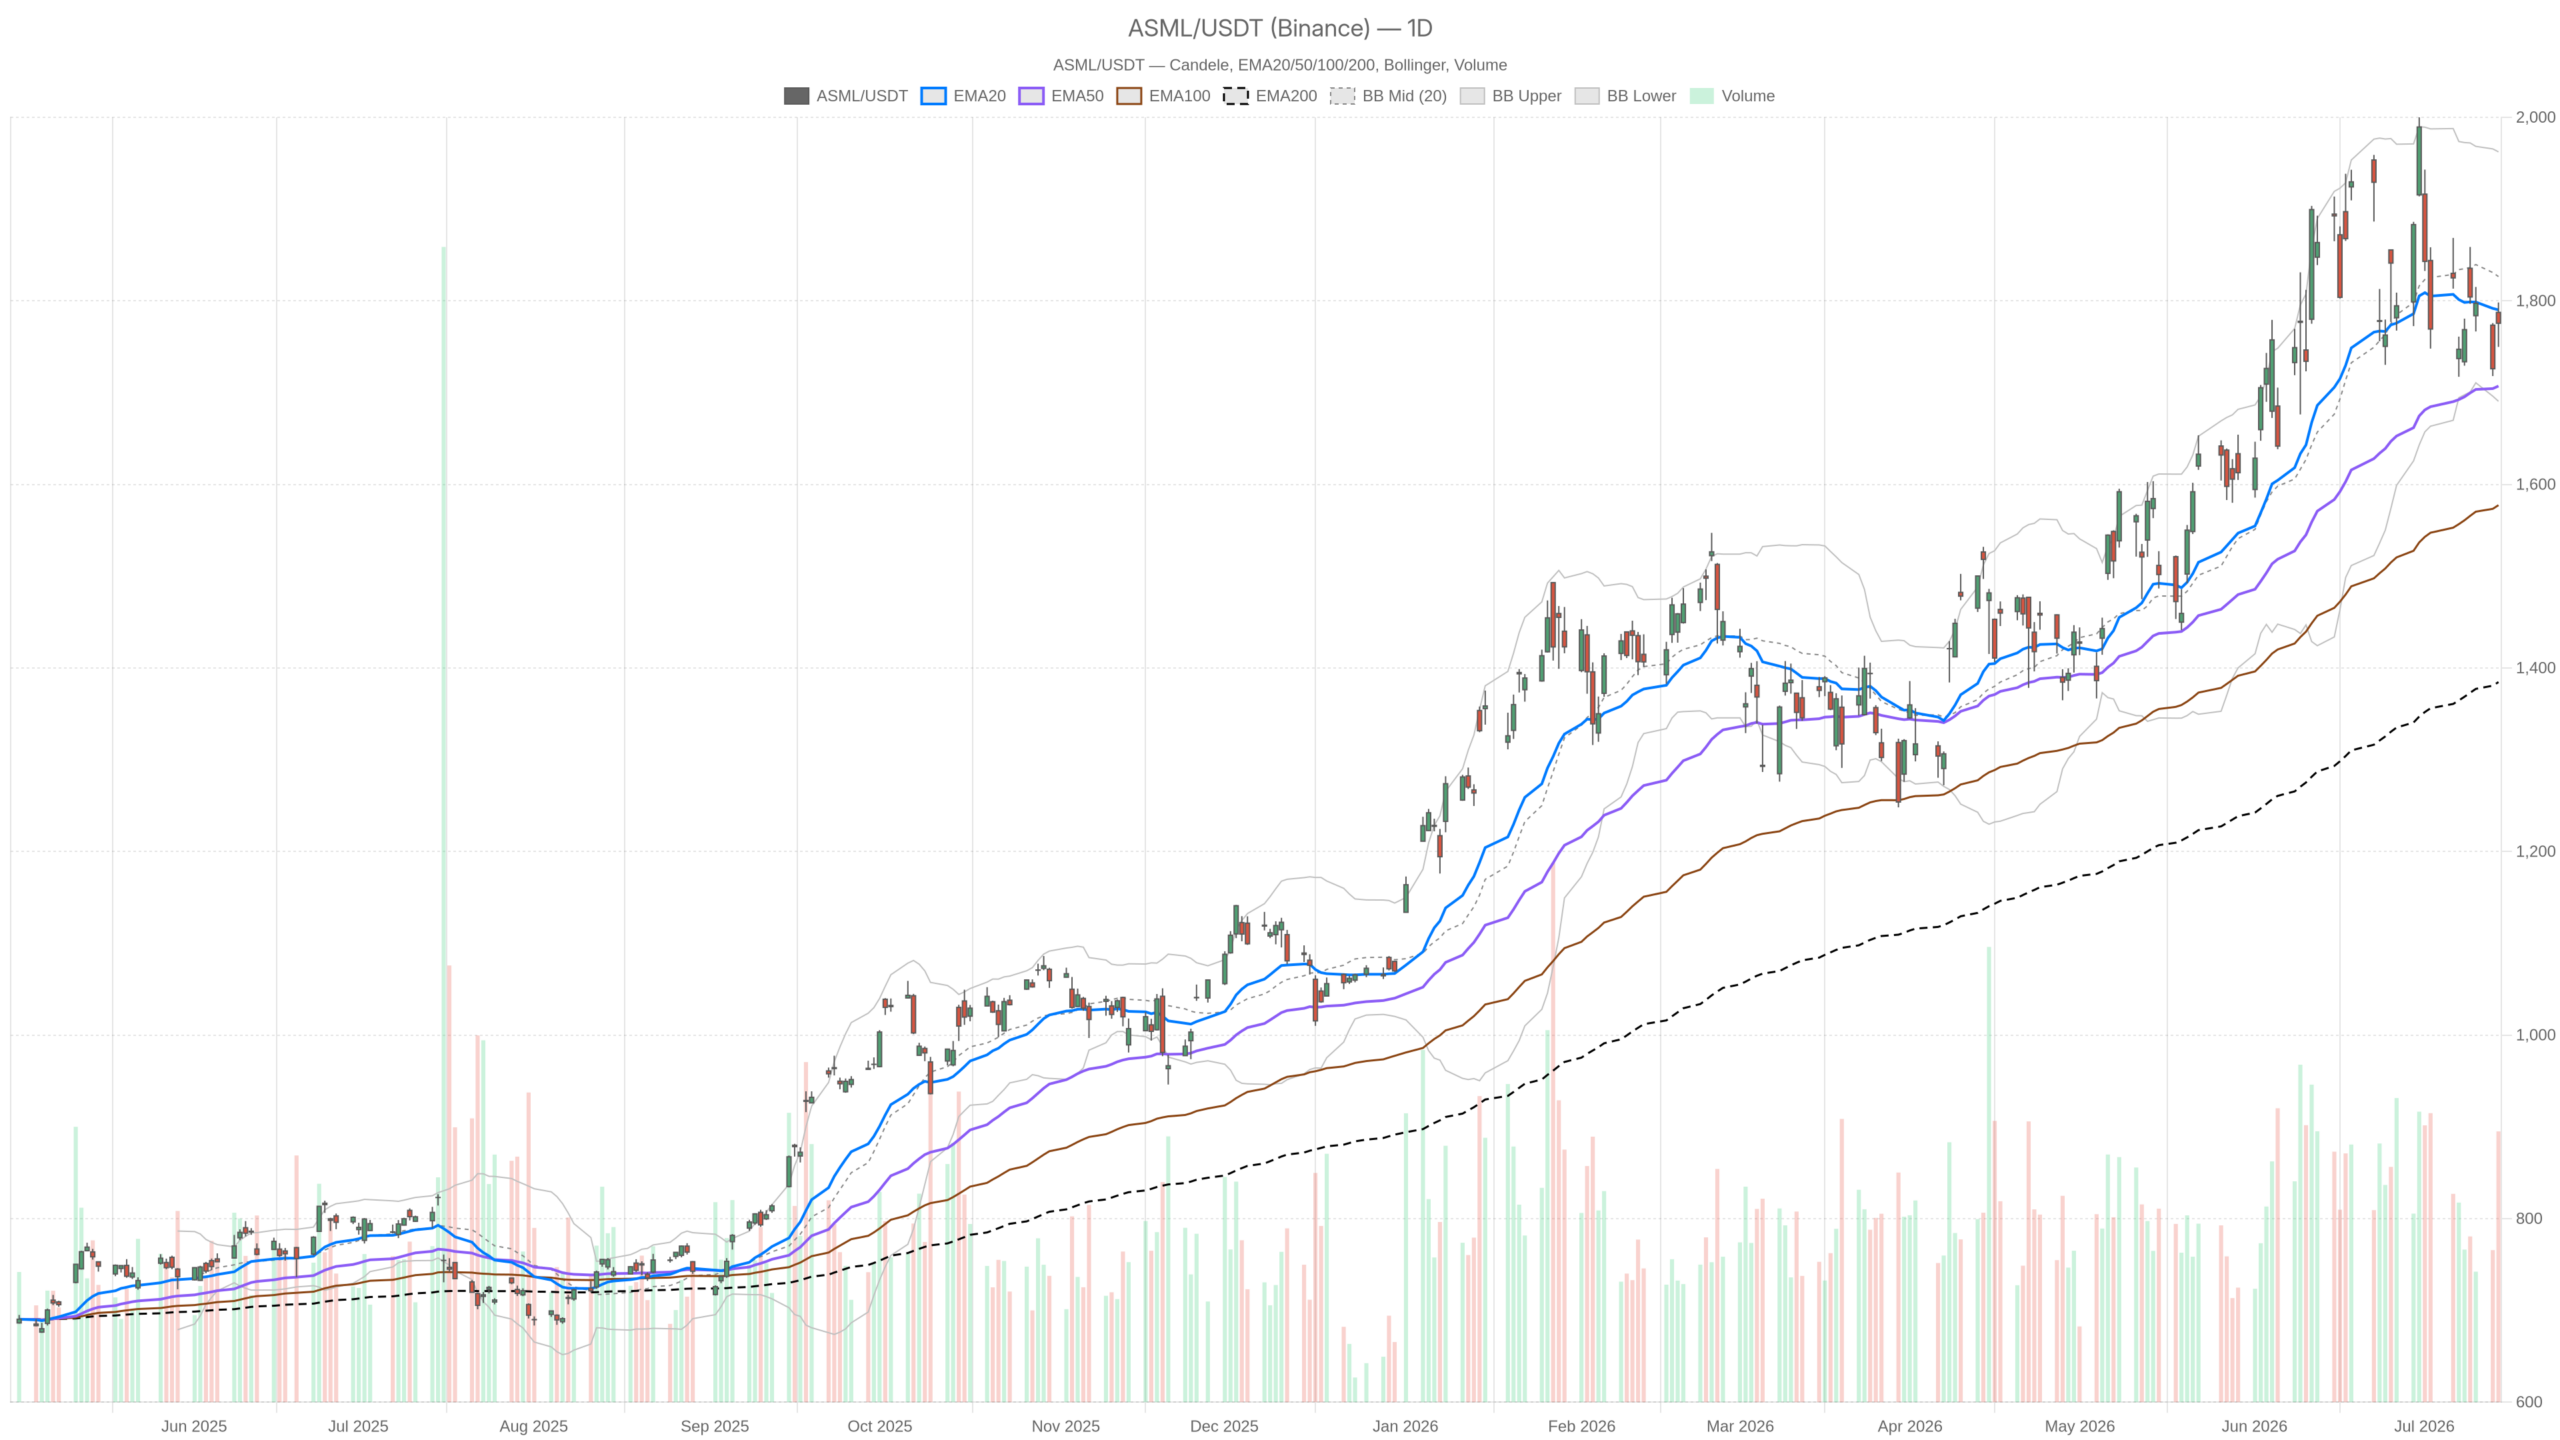
ASML’s daily bias is firmly neutral. Price at 1,775.64 sits between EMA20 resistance at 1,790.24 and EMA50 support at 1,707.20, offering no directional edge from structure alone.
The daily timeframe closes July 14 at 1,775.64, comfortably above the EMA50 at 1,707.20 and well above the EMA200 at 1,384.61. That long-term structure is unambiguously healthy. However, the EMA20 sits at 1,790.24 — just above the current close. Price has been unable to reclaim it. That short-term resistance matters.
The regime classification is explicitly neutral. The Bollinger Band midline at 1,826.47 reinforces the same message. ASML is trading in the lower half of its current volatility band, not pressing toward new highs.
Meanwhile, the daily RSI at 50.05 is as close to perfectly balanced as a momentum reading can be. There is no bullish nor bearish lean. The MACD histogram is at -20.06, with the signal line (35.78) running well above the MACD line (15.71). That divergence signals a fading upward impulse at the daily level. The trend is not broken, but it is losing energy. For bulls, this is a consolidation phase; for bears, it is early evidence of distribution.
Daily ATR stands at 90.15 — a wide range relative to the current pivot structure. The daily pivot point sits at 1,774.59, R1 at 1,799.32, and S1 at 1,750.91. The close of 1,775.64 essentially pins ASML right at the pivot.
ASML Hourly View: Subtle Recovery, Still Trapped
The hourly chart reflects indecision, not strength. ASML’s 1H price threads between key moving averages, with RSI parked at the neutral mid-line and no clear momentum signal emerging.
On the 1H chart, price closed the last session at 1,775.28 — nearly identical to the daily close. The EMA20 on this timeframe is at 1,773.54 and the EMA200 at 1,774.09. Price is essentially threading the needle between all three key moving averages. That compression signals indecision, not accumulation.
Notably, the 1H EMA50 at 1,787.27 sits above price and aligns closely with the daily EMA20 resistance zone around 1,790. That confluence makes the 1,787–1,799 range a meaningful supply area. On the other hand, the 1H MACD histogram has turned positive at 3.65. The MACD line at -4.09 is beginning to cross back toward the signal at -7.74. That is a tentative short-term improvement in momentum. Still, it does not override the daily MACD deterioration.
In contrast to the earnings excitement in the headlines, the 1H RSI at 49.64 mirrors the daily reading almost exactly. Both timeframes are parked at the mid-line. The technical momentum tells a story of a market catching its breath rather than breaking out.
15-Minute Context: Execution Zone to Watch
ASML’s 15-minute chart frames a tight consolidation zone. Price trades between 1,768 and 1,798, with no clear intraday directional edge ahead of the post-earnings session.
Price at 1,775.28 sits just below the 15m EMA20 at 1,777.69 and above the EMA50 at 1,773.16. The 15m EMA200 at 1,788.45 acts as near-term overhead resistance. The MACD histogram on this timeframe is mildly negative at -2.82. This suggests the most recent intraday push has stalled. ATR at 9.72 points to relatively tight short-term volatility. This is consistent with a market in wait-and-see mode heading into the post-earnings session open.
The 15m Bollinger Band range — 1,768.71 to 1,797.78 — frames the current consolidation zone neatly. Price needs to clear 1,797–1,799 convincingly to open the path toward R1 and the daily EMA20. A failure to hold 1,768–1,765 would put S1 at 1,750.91 back in play.
The Bullish Scenario: Earnings Momentum Meets Breakout
The bullish case hinges on the fundamental catalyst translating into technical confirmation. A daily close above the 1,790–1,800 zone would shift structure from neutral to constructive.
ASML raised guidance for the second time this year. The company cited continued customer investment in AI chips, memory, and advanced logic production. Bank of America reiterated its Buy rating following the guidance beat. Net profits rising from 2.3 billion to 2.9 billion euros year-over-year is a material improvement. That kind of earnings quality tends to attract institutional reallocation.
Technically, a clean daily close above the EMA20 at 1,790.24 would shift the daily structure from neutral to constructive. Ideally, price should also clear R1 at 1,799.32. The Bollinger upper band at 1,962.38 shows there is significant room to expand if momentum re-engages. The EMA50 and EMA200 alignment underneath current price provides a solid long-term floor. Therefore, for positioned bulls, the near-term trigger is a sustained reclaim of the 1,790–1,800 zone on volume.
The Bearish Scenario: Fading MACD and EMA Resistance
The bearish case does not require fundamental weakness. It only needs the earnings catalyst to have been priced in during the pre-report rally, leaving momentum exhausted at resistance.
The bearish scenario does not require a fundamental collapse. However, the strong earnings may already be priced in. The pre-earnings rally — including the 2.7% move on July 14 — could have exhausted buying pressure. The daily MACD histogram at -20.06 is the clearest warning sign. Momentum has been contracting while price hovered near recent highs. That is a textbook divergence pattern.
If ASML fails to hold the 1,750–1,751 support zone, sellers would gain structural control. The daily S1 and Bollinger lower band at 1,690.57 serve as deeper backstops. A daily close below 1,750 would invalidate the short-term bullish thesis. It would open the path toward the 1,707 EMA50 zone. The ATR at 90 points means any such move could be swift and uncomfortable for under-hedged positions.
Positioning and Volatility: A Market in Transition
ASML Holding N.V. New York Re stock demands patience over aggression. Elevated ATR at 90.15 and neutral RSI across timeframes argue against aggressive directional bets. The post-earnings session must resolve the current ambiguity.
Overall, ASML Holding N.V. New York Re stock sits at a technically ambiguous but fundamentally supported crossroads. The earnings results are strong. AI-driven demand, a second guidance raise, and a clear analyst endorsement from BofA all speak to structural business health. Yet the chart reflects a market that is digesting rather than accelerating.
At the same time, RSI neutrality across both daily and hourly frames sends a clear message. A deteriorating daily MACD and price pinned below the EMA20 reinforce it. Together, they argue against aggressive directional positioning right now.
Volatility, as measured by the daily ATR at 90.15, remains elevated. That creates meaningful risk in either direction. The post-earnings session will be the real test. Either buyers use the fundamental catalyst to reclaim the 1,790–1,800 range and restart the uptrend. Or the market interprets the gap-up as an opportunity to reduce exposure. Until one of those scenarios resolves with conviction on the daily close, ASML’s price action demands patience over aggression.
FAQ
Did ASML beat its Q2 earnings expectations?
Yes. ASML posted net profits of 2.9 billion euros in Q2, up from 2.3 billion in the same period of 2025, and raised full-year guidance for the second time this year.
What is the key resistance level for ASML Holding N.V. New York Re stock?
The 1,790–1,800 zone is the critical resistance area. It combines the daily EMA20 at 1,790.24 and the daily R1 pivot at 1,799.32. A daily close above this zone would shift the structure from neutral to constructive.
What is the key support level for ASML?
The daily S1 at 1,750.91 is the first major support. Below that, the EMA50 at 1,707.20 serves as a deeper floor, with the Bollinger lower band at 1,690.57 as a final backstop.
Is ASML’s technical outlook bullish or bearish right now?
The technical outlook is neutral. RSI sits at 50.05 — perfectly balanced — and price is trapped between EMA20 resistance at 1,790.24 and EMA50 support at 1,707.20. The MACD histogram at -20.06 warns of fading momentum despite strong fundamentals.
Disclaimer: This article is for informational purposes only and does not constitute financial advice, an investment recommendation, or a solicitation to buy or sell any financial instrument or cryptocurrency. The analysis provided is not indicative of future results. Investing in crypto assets and financial markets carries a high risk of capital loss. Always do your own research (DYOR) and consult a qualified financial advisor before making any decision.
Article produced with the assistance of artificial intelligence and reviewed by the editorial team.
