




International Business Machines stock suffered a historic collapse on July 14, 2026. Shares plunged roughly 25% after enterprise customers unexpectedly diverted IT budgets away from its core software and infrastructure deals in late June. The stock closed at $217.07. The charts now reveal deeply oversold territory — without a credible near-term floor yet established.
Summary
Key takeaways
- IBM shares fell approximately 25% on July 14, 2026, following a preliminary warning that enterprise customers redirected IT budgets in the final weeks of June
- The stock closed at $217.07, trading well below its daily EMA20 at $276.52, EMA50 at $268.37, and EMA200 at $266.03
- Daily RSI reached 30.34 near oversold territory, while hourly RSI collapsed to 14.92 — a severely oversold reading
- Daily ATR spiked to $16.65, and price closed below the daily lower Bollinger Band at $232.77
- Critical support lies at $210.22 (daily S1); resistance stands at $220.07 (daily pivot) and $226.92 (daily R1)
International Business Machines Stock Suffers Historic Technical Breakdown
International Business Machines stock suffered a single-day collapse on July 14, 2026, that completely rewrote its technical structure. The selloff was not a slow deterioration. IBM fell 25.9% during the morning session after confirming enterprise spending patterns shifted abruptly at the end of Q2. Customers rushed to redeploy IT budgets away from IBM’s core offerings. Notably, Bloomberg characterized the share behavior as resembling a penny stock — a striking description for a blue-chip name.
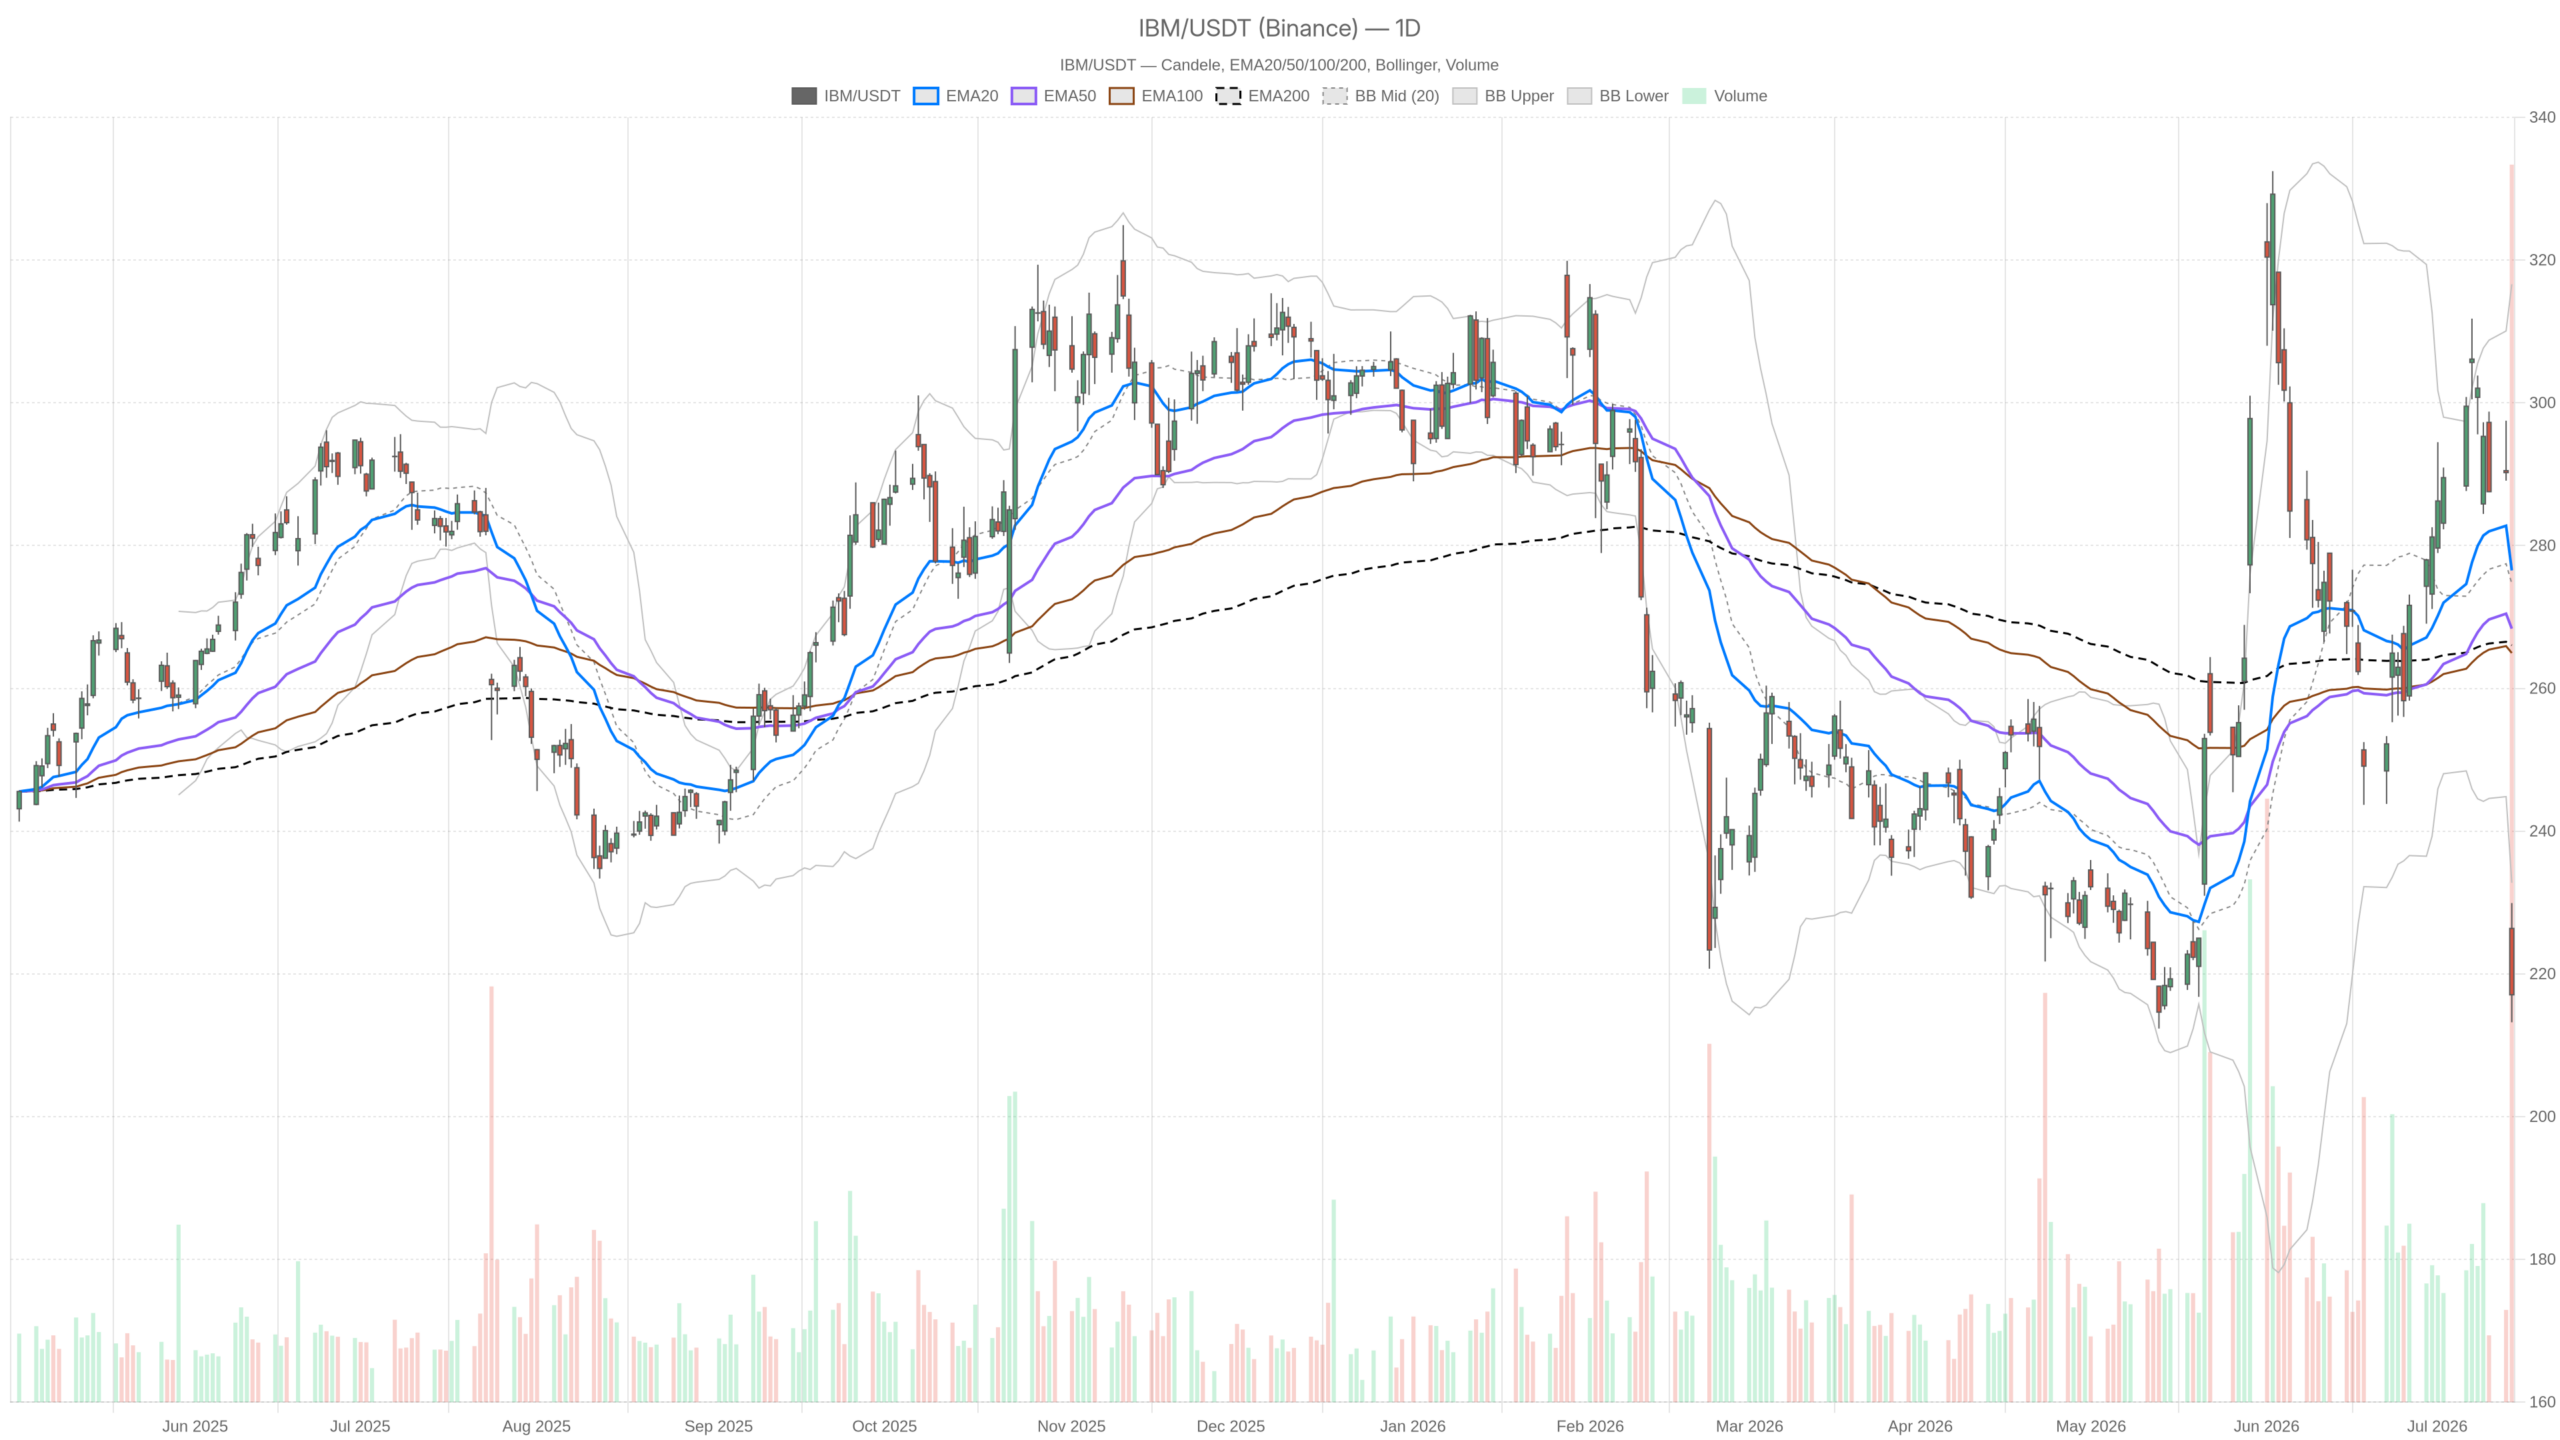
On July 14, the daily candle opened at $226.37 and reached an intraday high of $229.92. It then collapsed to a low of $213.22 before closing at $217.07. The range exceeded $16, reflecting an ATR of $16.65. That level of daily volatility is extreme for this stock and signals ongoing risk repricing rather than consolidation.
Daily Timeframe: Bearish Bias Despite a Neutral Label
The daily chart carries a neutral regime label, but the indicator readings tell a clearly bearish story for International Business Machines stock. Price closed well below every key moving average, and momentum continues to deteriorate across multiple metrics.
EMA Stack and Pivot Structure Confirm Weakness
IBM’s close at $217.07 sits well below all three key EMAs. The EMA20 stands at $276.52, the EMA50 at $268.37, and the EMA200 at $266.03. The stock trades nearly $50 below its short-term moving average. This is not a neutral setup — it is a stock in structural breakdown mode.
Meanwhile, the daily pivot structure places the pivot point at $220.07, with R1 at $226.92 and S1 at $210.22. The stock closed below the pivot at $217.07, keeping the near-term bias tilted downward. Consequently, the S1 at $210.22 becomes the next meaningful reference level if selling resumes.
Momentum and Volatility Indicators Flash Warning
Notably, the daily RSI at 30.34 presses against oversold territory. However, a near-oversold RSI in a shock-driven selloff is not automatically bullish. Oversold conditions can persist for weeks when a new fundamental narrative forces broad valuation recalibration. This reading flags exhaustion potential, not a reversal signal on its own.
At the same time, the MACD reinforces the bearish case. The MACD line sits at 2.06, the signal at 6.35, producing a histogram of -4.29. The histogram is negative and expanding, confirming that selling pressure remains dominant.
Meanwhile, the Bollinger Bands show the daily midline at $274.69 and the lower band at $232.77. IBM’s close at $217.07 sits below the lower band — a sign of unusual statistical deviation. In a fundamental repricing event, however, price can remain below the band for an extended period.
Hourly Timeframe Confirms Extreme Weakness
The 1-hour chart provides no relief and confirms that selling momentum is accelerating, not fading. Every indicator on this timeframe points in the same bearish direction for IBM stock.
RSI Collapse and MACD Deepen the Bearish Case
The hourly RSI collapsed to 14.92 — a reading that is severely oversold by any measure. In normal conditions, this level would attract algorithmic buying interest. On a day defined by a historic earnings warning, however, it reflects the sheer velocity of the selloff rather than an imminent reversal.
The hourly MACD is deeply negative: the line at -20.87, signal at -14.41, and histogram at -6.46. The histogram remains negative and widening. No bullish crossover is forming on this timeframe. Unlike the daily chart, where some residual support might be argued, the hourly picture shows accelerating downside momentum.
Furthermore, the hourly EMAs are stacked bearishly. EMA20 sits at $255.17, EMA50 at $274.04, and EMA200 at $273.52. Price at $217.08 trades more than $38 below its hourly EMA20. That gap alone illustrates the scale of dislocation. There is no near-term EMA support close to current price levels.
Overall, the hourly Bollinger midline is at $265.26, with the lower band at $196.30. Price presses toward this lower band as well. The hourly ATR of $8.93 confirms elevated intraday volatility. Meanwhile, the hourly pivot at $217.86 keeps IBM fractionally below the pivot — another confirmation of short-term weakness.
Key Scenarios for IBM Stock: Recovery or Further Decline
The 15-minute timeframe carries an explicit bearish regime label, though micro-divergences hint at a potential short-term pause. The 15m RSI sits at 24.07 — oversold — but a small positive divergence is forming. The MACD histogram at this level is at +2.53, while the MACD line (-8.73) remains below the signal (-11.26). This could support a brief technical bounce or consolidation near current levels. Still, no structural reversal signal has emerged. The 15m Bollinger midline at $218.07 and R1 at $217.87 act as immediate resistance.
What Must Change for a Bullish Recovery
A bullish recovery case for IBM stock exists but requires specific conditions. First, the stock would need to hold above daily S1 support at $210.22 and begin reclaiming the pivot at $220.07. A close above that pivot on meaningful volume would be the first credible sign of stabilization.
Beyond price structure, the bullish case depends heavily on IBM providing clarity about its Q2 shortfall when it reports full earnings. If the preliminary warning proves to be a worst-case scenario — and actual results come in less damaging — the market would likely stage a relief rally. At the same time, any signal that enterprise IT spending redirection is temporary, rather than structural, would be supportive. The daily RSI nearing oversold levels and the lower Bollinger Band breach both indicate the stock is statistically stretched to the downside.
Why the Bearish Downtrend May Persist
In contrast, the bearish scenario carries more near-term weight. The fundamental trigger — enterprise customers moving budgets away from IBM’s software and infrastructure — is not a one-quarter noise event if it reflects a deeper shift in how companies allocate AI and IT spending. Notably, cybersecurity and AI chip stocks soared on the same day IBM crashed, suggesting capital rotation rather than broad tech weakness. That dynamic could prove sticky.
Technically, IBM remains in a confirmed downtrend on every timeframe. Price sits below all key EMAs on the daily and hourly charts. MACD momentum is negative and deteriorating on both. The stock would need to reclaim $226.92 — daily R1 — to even begin challenging the bearish structural thesis. Below $210.22, the next reference level is the hourly lower Bollinger Band near $196.30.
Positioning, Volatility, and Uncertainty Ahead
International Business Machines stock is now a high-volatility, fundamentally disrupted name with a technical profile reflecting genuine market fear. The daily ATR of $16.65 means wide price swings remain the base case for coming sessions. RSI extremes across all three timeframes — 30 on the daily, 14 on the hourly, 24 on the 15-minute — signal capitulation-like conditions, but not yet a confirmed base. Until IBM either defends the $210 area convincingly or delivers a formal earnings update that recalibrates expectations, the path of least resistance remains lower. Caution is warranted on both sides of this trade.
FAQ
What caused International Business Machines stock to crash on July 14, 2026?
IBM issued a preliminary warning that enterprise customers unexpectedly diverted IT budgets away from its software and infrastructure deals in the final weeks of June. This triggered a roughly 25% single-day selloff, with shares closing at $217.07.
Is IBM stock oversold after the 25% drop?
Yes. The daily RSI reached 30.34, near oversold territory, while the hourly RSI collapsed to 14.92 — a severely oversold reading. However, oversold conditions can persist for weeks when driven by a fundamental repricing event rather than normal market fluctuations.
What are the key support and resistance levels for IBM stock?
Key support sits at $210.22 (daily S1), with a secondary level near $196.30 (hourly lower Bollinger Band). Resistance stands at $220.07 (daily pivot) and $226.92 (daily R1). A close above $220.07 on meaningful volume would be the first sign of stabilization.
Could IBM stock recover from this selloff?
A recovery requires IBM to hold above $210.22 and reclaim the $220.07 pivot on meaningful volume. It also depends heavily on IBM’s full Q2 earnings clarifying whether the preliminary warning represented a worst-case scenario or a deeper structural shift in enterprise IT spending patterns.
Disclaimer: This article is for informational purposes only and does not constitute financial advice, an investment recommendation, or a solicitation to buy or sell any financial instrument or cryptocurrency. The analysis provided is not indicative of future results. Investing in crypto assets and financial markets carries a high risk of capital loss. Always do your own research (DYOR) and consult a qualified financial advisor before making any decision.
Article produced with the assistance of artificial intelligence and reviewed by the editorial team.
