




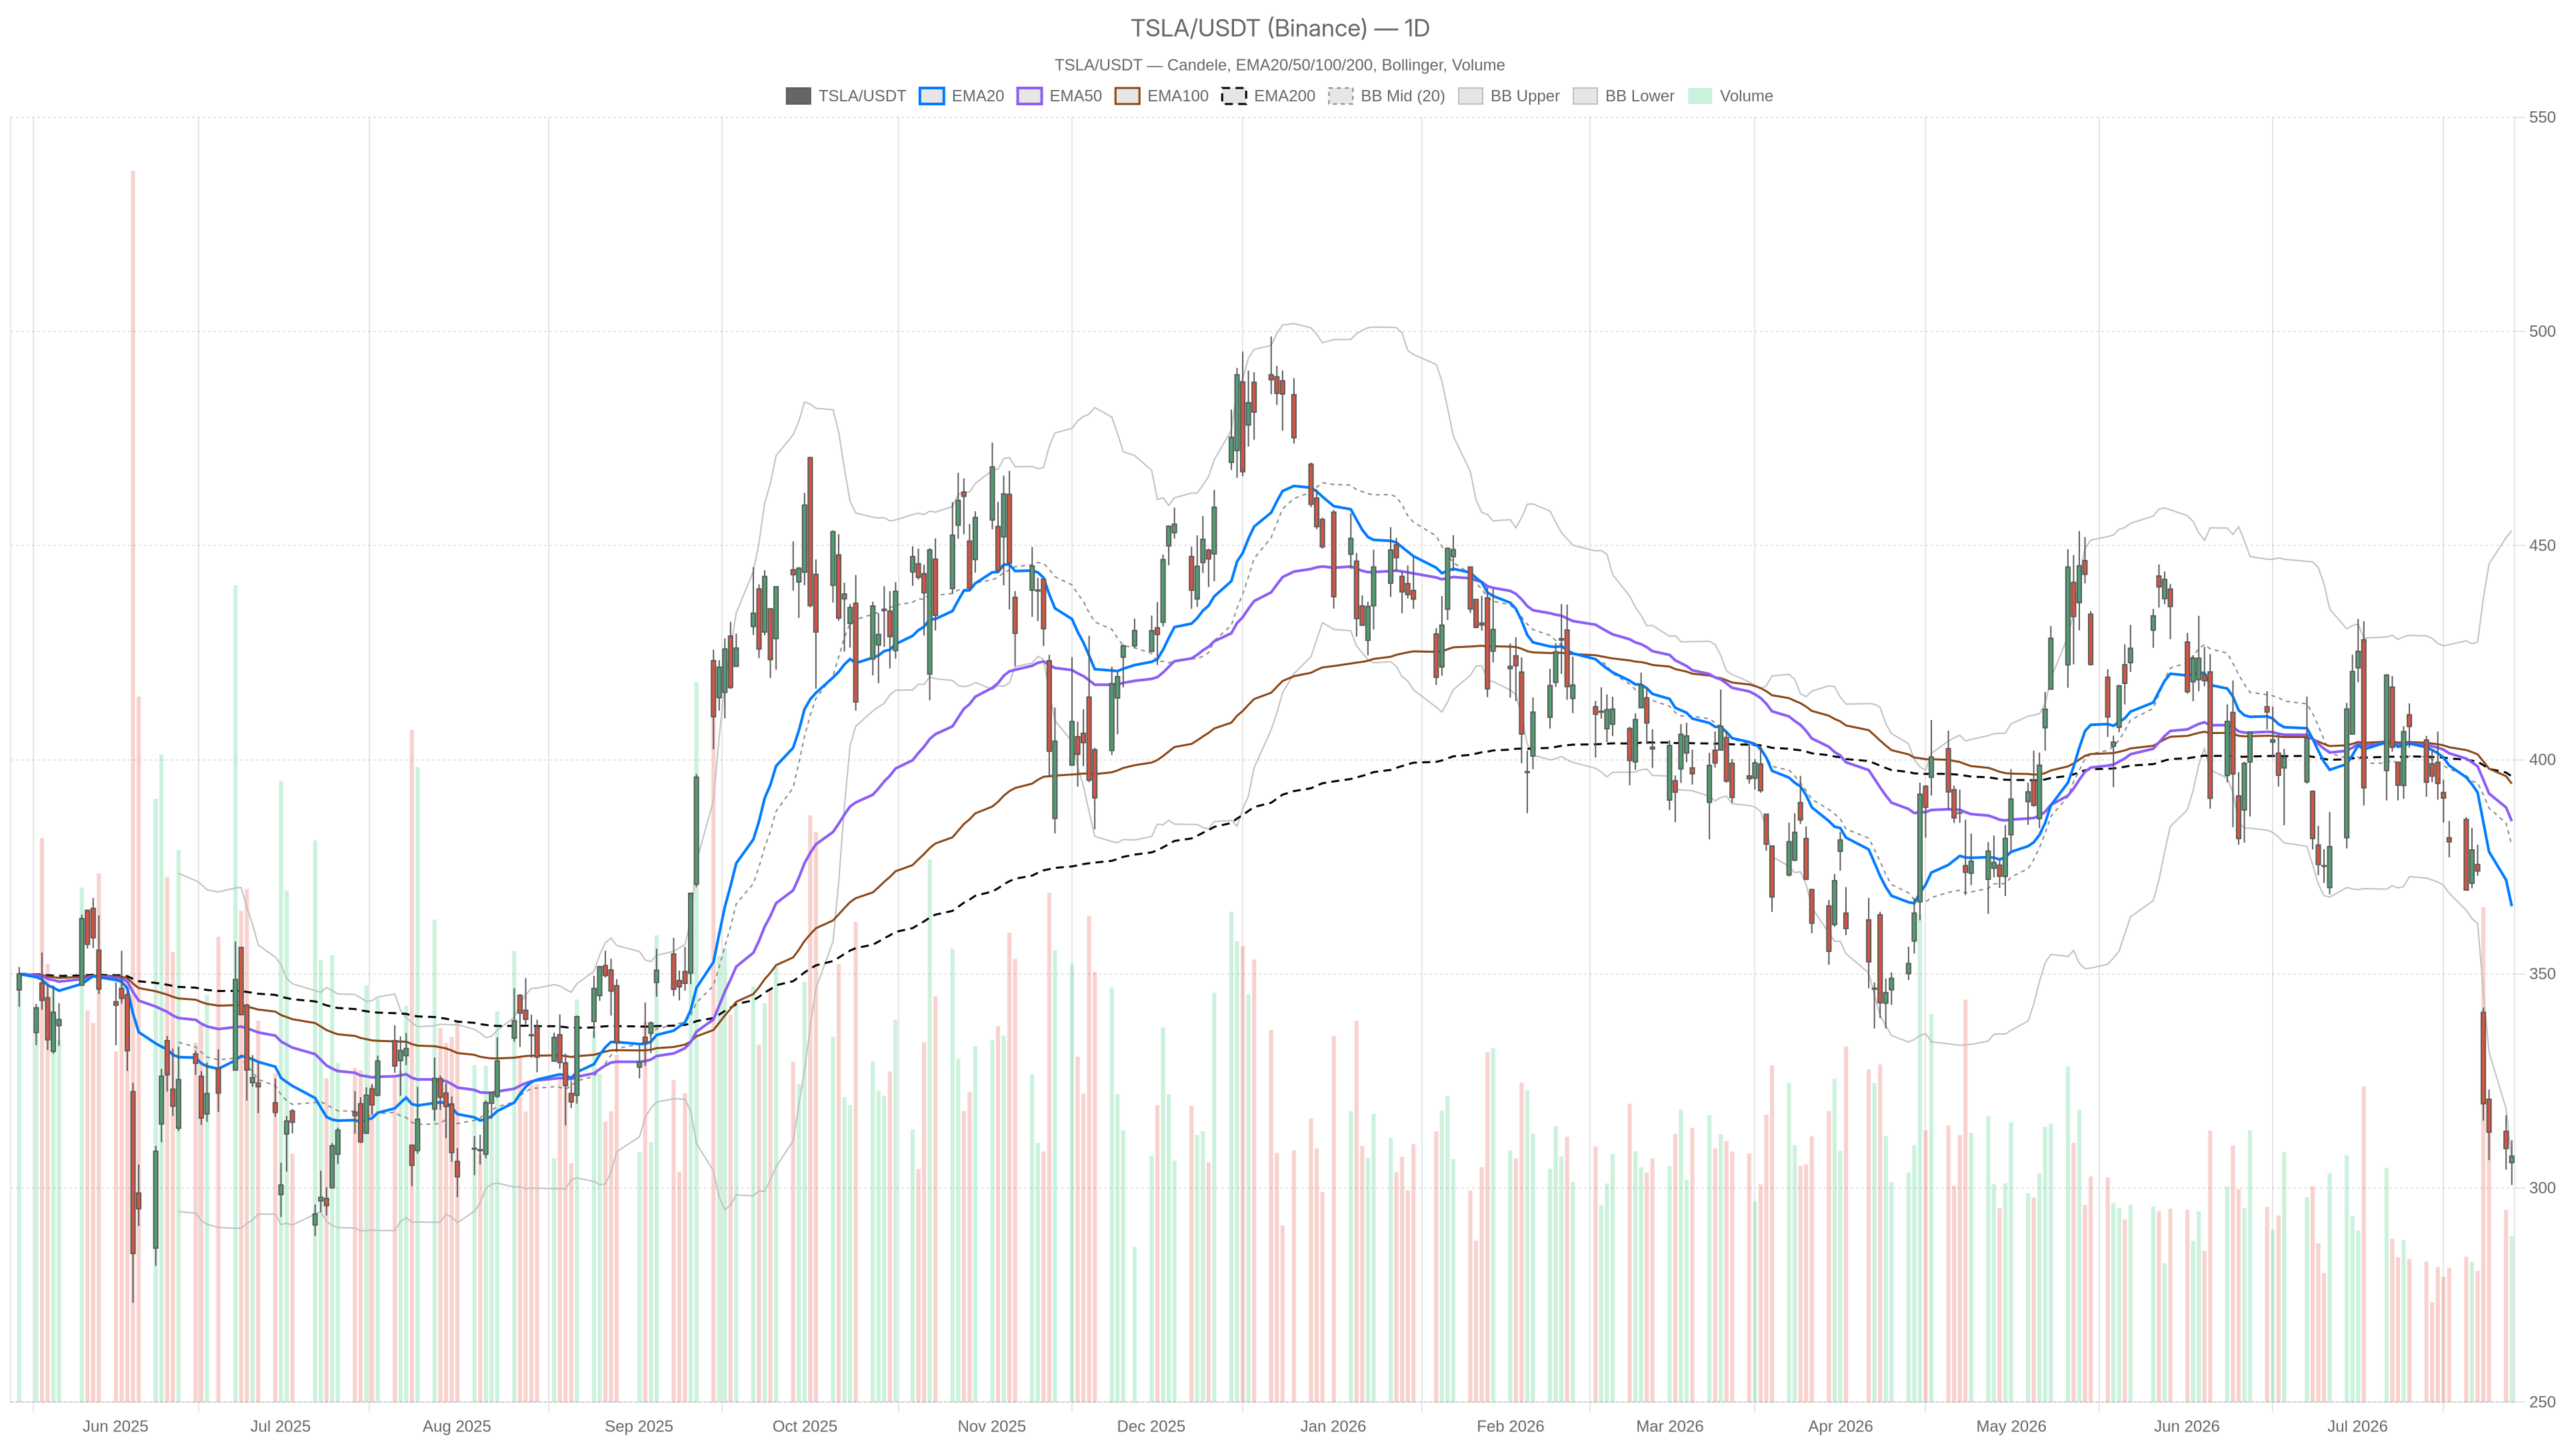
Tesla Stock is in a precarious position, trading at $307.44 on July 28. TSLA hugs the lower daily Bollinger Band. The trend is firmly bearish across every major timeframe. Momentum is deeply negative. The central question is whether the $300 level can hold.
Summary
Key takeaways
- Tesla Stock trades at $307.44, pinned just above its daily lower Bollinger Band at $306.47.
- Daily RSI sits at 27.03 — deeply oversold — while the MACD histogram continues to widen negatively.
- All major EMAs (20, 50, 200) remain far above price, confirming a stacked bearish alignment.
- The hourly MACD histogram has turned positive, hinting at short-term momentum deceleration.
- A break below $300 would open the door to further downside, with S1 support at $301.70.
Tesla Stock Daily Chart Defines the Bear Case
The daily chart for Tesla Stock paints an unambiguously bearish picture. Price is trapped far below all major moving averages. At $307.44, it trades well below the EMA20 at $365.79, the EMA50 at $385.67, and the EMA200 at $396.11. This stacked bearish alignment reflects months of sustained selling, not a temporary pullback.
The MACD reinforces the case. The line reads -22.16 against a signal of -12.51, producing a histogram of -9.65. That histogram is deeply negative and widening. Downside momentum is not stabilizing — it is accelerating.
Meanwhile, the daily RSI has dropped to 27.03. Tesla Stock is now firmly in oversold territory. Oversold conditions do not automatically trigger recoveries. But they do flag exhaustion risk. At this reading, any fresh wave of selling becomes increasingly difficult to sustain without at least a technical bounce.
Bollinger Bands add important context. The lower band sits at $306.47, effectively right at current price. The midline is $379.98 and the upper band $453.48. That spread reflects extreme volatility. It also shows how far price has drifted from its statistical center. Notably, price is barely above the lower band. This proximity signals genuine stress, not a simple pullback from highs.
Daily pivot data places the pivot point at $306.43, R1 at $312.16, and S1 at $301.70. Price is pinned between the pivot and R1. There is very little room before testing either resistance or the first support level below.
1H Chart: Bearish Regime, but Momentum Turning
The hourly chart confirms the bearish regime for Tesla Stock. Yet it also shows early signs that selling pressure is losing intensity. The EMA structure mirrors the daily. Price at $307.49 trades beneath the EMA20 at $312.59, the EMA50 at $334.12, and the EMA200 at $376.59. There is no structural improvement at this level.
However, the hourly MACD introduces a nuance. The line stands at -8.94 against a signal of -11.32. The histogram now reads +2.38. A positive histogram in an otherwise bearish setup means the rate of decline is slowing intraday. That is not a reversal signal. But it does suggest the selling pressure is momentarily losing intensity.
The hourly RSI at 32.85 approaches oversold territory without crossing into it. Combined with the MACD histogram crossover, the 1H frame hints at a potential short-term stabilization. Still, the daily picture remains unambiguously bearish. The hourly data introduces a tentative counterargument — fragile, but worth monitoring.
Hourly Bollinger Bands are narrow. The lower band sits at $303.82, the upper at $312.17. Price trades near the midpoint of this range at $307.99. This suggests short-term equilibrium rather than directional conviction. The hourly ATR of $4.26 implies modest intraday volatility, keeping risk manageable.
15-Minute Execution Context for TSLA
The 15-minute timeframe shows a neutral consolidation. It offers only tactical entry refinement within the broader bearish trend. RSI is at 53.04 — the most balanced reading across all three timeframes. The MACD histogram is slightly positive at +0.08. Price at $307.49 sits above the EMA20 of $306.60.
This matters for timing. The 15m data suggests very short-term traders may have found a temporary equilibrium near the $306–$308 range. The ATR here is just $1.44, indicating tight, range-bound action. Overall, this timeframe is useful only as an entry refinement tool. It does not alter the dominant bearish thesis from the daily frame.
News Flow Reinforces Tesla Stock’s Technical Pressure
The fundamental backdrop amplifies Tesla Stock’s bearish technical picture. Analyst warnings and institutional moves add conflicting signals to the mix. Gary Black publicly warned that Tesla Stock could break below $300. He cited excessive AI-related valuations coming under broader market pressure. A Seeking Alpha analysis echoed that view. It flagged shrinking margins, elevated valuation, and persistent bearish technicals as reasons to sell.
At the same time, Cathie Wood’s ARK Invest doubled down on its Tesla position following the recent price drop. That adds a contrarian data point — institutional conviction buying into weakness. However, ARK’s move raises a question. Is this smart accumulation at distressed prices? Or is it simply defending an existing thesis in a deteriorating market?
The stock also fell sharply following a mixed quarterly update. Multiple outlets have noted Tesla hasn’t been this oversold in over a year. That confirms what the RSI is already showing — the selloff has been severe by historical standards.
Bullish Scenario for Tesla Stock
For Tesla Stock bulls to regain control, the $300–$306 zone must hold as a floor. That would need to trigger a relief rally. If the daily lower Bollinger Band at $306.47 contains selling, a technical bounce becomes plausible. The RSI would need to curl higher from oversold levels. An initial move toward the pivot at $306.43 and then R1 at $312.16 could follow.
The hourly MACD histogram already turning positive is an early sign. It is unconfirmed but suggests this process could be beginning.
ARK Invest’s accumulation behavior adds institutional demand in this zone. Should broader market sentiment stabilize and AI valuation concerns ease, Tesla could see a short-covering bounce. However, a sustained recovery above the daily EMA20 near $365 remains distant. That level would be required to challenge the bearish structural thesis meaningfully.
Bearish Scenario: The $300 Break
The bearish case for Tesla Stock is better supported by the evidence. A break below $300 would open the door to further downside. A daily close below the lower Bollinger Band at $306.47 would be the first warning. A break below S1 at $301.70 would then open the door to Gary Black’s target below $300. Daily momentum is still deteriorating. All major EMAs point lower. There is no structural floor being built at current prices.
Moreover, the MACD line at -22.16 continues to diverge from the signal line. Until that gap begins to close meaningfully on the daily frame, bearish momentum remains the dominant force. Any 1H or 15m recovery attempts are best treated as noise within a larger downtrend. Confirmation from the daily structure is required before calling any bottom.
Positioning Tesla Stock in a High-Volatility Environment
Tesla Stock sits at a crossroads between technical exhaustion and structural deterioration. Elevated volatility keeps both directions firmly in play. The daily ATR of $16.27 reflects significant daily swings. This is not a quiet consolidation environment. Volatility remains elevated. With the stock pinned just above critical support, the risk of a sharp move in either direction is real.
Therefore, the dominant bias remains bearish based on daily structure and momentum. The 1H frame offers a tentative note of caution — momentum is decelerating intraday. But it does not invalidate the broader trend. The 15m frame is neutral. It is useful only for precise entry timing rather than directional conviction.
The $300 level is the line in the sand. How Tesla Stock behaves around that threshold in the coming sessions will define what comes next. Either the oversold condition leads to a technical bounce. Or it marks another chapter in a prolonged downtrend.
FAQ
Is Tesla Stock oversold right now?
Yes. The daily RSI sits at 27.03, deep in oversold territory. The hourly RSI at 32.85 is also approaching oversold levels. Multiple outlets have noted Tesla hasn’t been this oversold in over a year, confirming the severity of the selloff.
What is the key support level for Tesla Stock?
The critical support zone is $300–$306. The daily lower Bollinger Band sits at $306.47, and S1 pivot support is at $301.70. A break below $300 would likely trigger further selling and open the door to deeper downside.
Are there any signs of a reversal for TSLA?
The hourly MACD histogram has turned positive at +2.38, suggesting selling pressure is decelerating intraday. However, the daily chart remains firmly bearish. No confirmed reversal signal has emerged yet. Any bounce would need to clear the daily EMA20 near $365 to challenge the bearish thesis.
What are analysts saying about Tesla Stock?
Gary Black warned Tesla Stock could break below $300, citing excessive AI-related valuations under market pressure. Seeking Alpha flagged shrinking margins and bearish technicals as reasons to sell. Meanwhile, Cathie Wood’s ARK Invest has been buying into the weakness, creating a notable contrarian signal.
Disclaimer: This article is for informational purposes only and does not constitute financial advice, an investment recommendation, or a solicitation to buy or sell any financial instrument or cryptocurrency. The analysis provided is not indicative of future results. Investing in crypto assets and financial markets carries a high risk of capital loss. Always do your own research (DYOR) and consult a qualified financial advisor before making any decision.
Article produced with the assistance of artificial intelligence and reviewed by the editorial team.
