




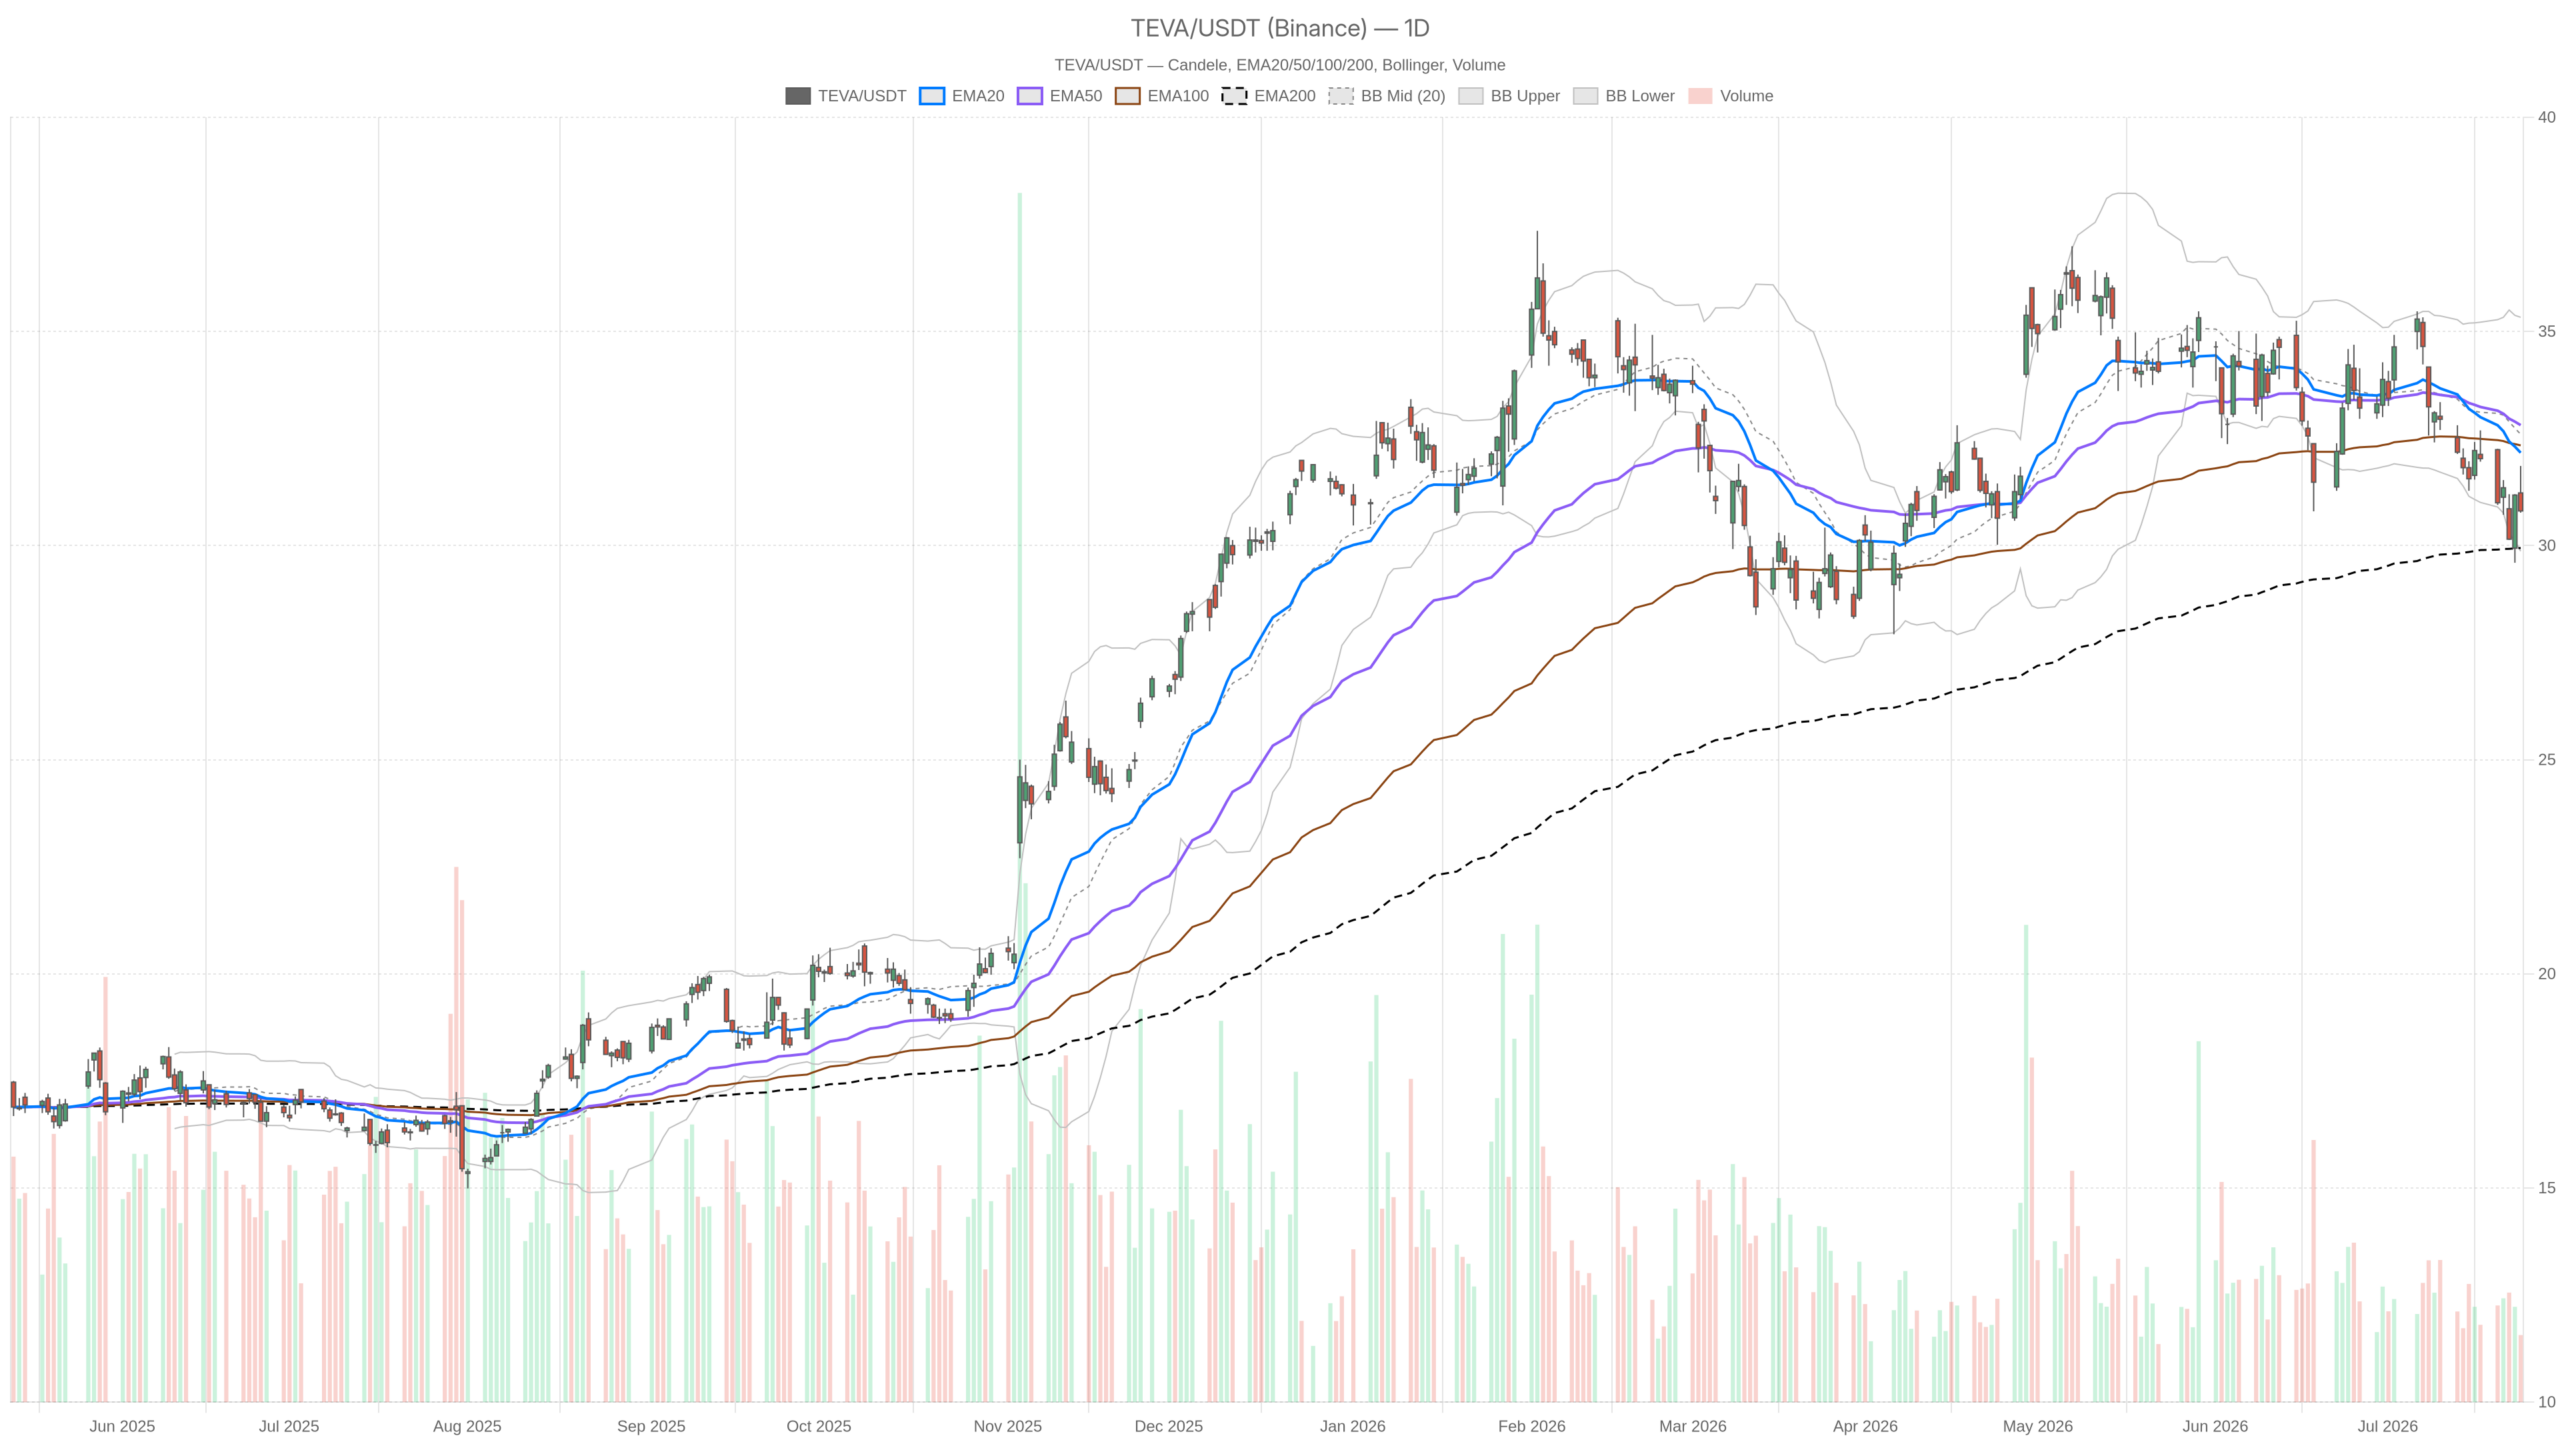
Teva Pharmaceutical Industries stock closed at $30.81 on July 24, sitting below key moving averages. Wall Street analysts project over 60% upside with a 100% buy rating. The daily chart, however, is not confirming that optimism. The gap between bullish narratives and technical weakness defines TEVA’s current tension.
Summary
Key takeaways
- TEVA closed at $30.81 on July 24, below the daily EMA20 at $32.17 and EMA50 at $32.81
- The EMA200 at $29.94 serves as the critical structural floor that must hold for any recovery
- Daily RSI at 40.15 reflects weak momentum, while the MACD confirms persistent downward pressure
- Wall Street analysts maintain a 100% buy rating with price targets implying over 60% upside
- The hourly MACD histogram shows a slight positive divergence, hinting at fading selling pressure near current levels
Daily Timeframe: Bearish Pressure Beneath the Surface
The daily chart leans bearish despite an official neutral regime reading. Price sits below both the EMA20 and EMA50, with only the EMA200 providing structural support.
Momentum Indicators Confirm Downward Pressure
Meanwhile, the daily RSI at 40.15 places TEVA in weak territory. It is not yet oversold, but it is approaching the zone where momentum shifts become possible. The MACD line at -0.75 sits below its signal line at -0.54. The negative histogram of -0.21 confirms downward momentum remains in force.
Bollinger Bands and Pivot Levels Define Key Zones
The Bollinger Bands add further context. The midline sits at $32.60, and price is pressing toward the lower band at $29.87. A sustained break below that level would mark meaningful deterioration. The ATR at $1.03 reflects moderate daily volatility — enough range to matter for positioning. The daily pivot at $31.15 marks the first hurdle for any recovery, with resistance at $31.52 and support at $30.43. Price closed just below the pivot, a subtle but real sign of selling pressure.
Hourly Timeframe: The Bearish Regime Adds Conviction
On the 1H chart, the regime is explicitly flagged as bearish, and the structure backs it up. Price at $30.82 sits below all three key hourly moving averages.
Resistance Structure Limits Recovery Potential
Price at $30.82 trades below the H1 EMA20 at $30.92 and well below the EMA50 at $31.29. Meanwhile, the EMA200 on the hourly at $32.56 represents a major overhead obstacle. Significant layered resistance stands between current price and any recovery attempt.
Early Divergence Signal in Short-Term Momentum
However, one nuanced signal appears in the H1 MACD. The histogram is slightly positive at 0.06, even as the MACD line remains negative at -0.09. That mild divergence hints at fading selling pressure in the short term. It is too early to call this a reversal, but downward momentum may be losing intensity near current levels.
Low Volatility Suggests Consolidation
The 1H RSI at 44.73 is consistent with the daily picture — weak, not capitulating. Meanwhile, the hourly Bollinger Bands show price trading near the midline at $30.73 after having been compressed. The hourly ATR at $0.29 is tight. This reinforces the idea that the market is consolidating within the broader downtrend.
15-Minute Chart: Compression and Indecision
At the intraday level, the 15-minute chart offers no clear directional edge. The regime is neutral, with price range-bound and indicators showing a coiled, low-energy environment.
The MACD is barely negative at -0.01 with a histogram at -0.02. The EMA20 and EMA50 on this timeframe are tightly clustered around $30.88–$30.90. Price trades just below them. For short-term traders, this is simply a waiting pattern ahead of a larger move.
The Bullish Case: Pipeline Catalyst and Analyst Conviction
The bullish argument for Teva Pharmaceutical Industries stock rests on overwhelming analyst conviction and a pipeline catalyst. A potential blockbuster drug sits at the center of the investment thesis.
Analysts carry a 100% buy rating on the stock, with price targets implying gains exceeding 60% from current levels. Recent commentary points to the pipeline candidate as the kind of catalyst that can override technical weakness entirely — if it materializes.
On the chart, the bullish scenario requires price to reclaim the daily pivot at $31.15 first. From there, it must challenge the $31.52 resistance. A decisive move back above the EMA20 at $32.17 would represent a genuine technical shift. Notably, the EMA200 at $29.94 holding as support is the critical underpinning for any recovery attempt.
The Bearish Scenario: What Invalidates the Recovery
In contrast, the bear case centers on price failing to hold above the EMA200 at $29.94. A close below that level would represent a meaningful structural breakdown.
Notably, the lower Bollinger Band at $29.87 is closely aligned with the EMA200. This creates a confluence zone that bears will watch closely. The daily MACD remains in a negative cross, and the RSI has not yet shown a hook upward.
Without a catalyst, there is limited technical reason for buyers to step in aggressively. Whether it be earnings, pipeline news, or a broad market lift — nothing is currently providing that spark. The pattern is clear: price trades below both the EMA20 and EMA50 on the daily chart. That rarely resolves quickly without a catalyst.
Positioning in a Market Full of Contradictions
Overall, Teva Pharmaceutical Industries stock presents an unusual setup where strong analyst conviction clashes with a chart under distribution. Neither the bull nor the bear case is cleanly confirmed.
The daily and hourly timeframes align in showing a stock under pressure. Yet the EMA200 support and the early MACD histogram improvement on the hourly prevent a clean bearish thesis. Near-term risk sits to the downside. However, longer-term optionality — driven by pipeline catalysts — keeps the stock from being a straightforward short. Volatility, as measured by the daily ATR at $1.03, suggests meaningful swings remain likely around any news flow. Until price reclaims the daily pivot and the EMA20, the chart demands patience rather than conviction.
FAQ
What is the current price of Teva Pharmaceutical Industries stock?
Teva Pharmaceutical Industries stock closed at $30.81 on July 24, sitting below the daily EMA20 at $32.17 and the EMA50 at $32.81.
What is the analyst consensus on TEVA?
Wall Street analysts maintain a 100% buy rating on the stock, with price targets implying potential gains exceeding 60% from current levels.
What is the key support level to watch for TEVA?
The EMA200 at $29.94 is the critical structural floor. A close below that level, which aligns closely with the lower Bollinger Band at $29.87, would mark a meaningful breakdown.
Is the technical picture bullish or bearish for TEVA?
The daily chart leans bearish, with the RSI at 40.15 and a negative MACD cross. However, the hourly MACD shows early signs of fading selling pressure, preventing a clean bearish thesis.
Disclaimer: This article is for informational purposes only and does not constitute financial advice, an investment recommendation, or a solicitation to buy or sell any financial instrument or cryptocurrency. The analysis provided is not indicative of future results. Investing in crypto assets and financial markets carries a high risk of capital loss. Always do your own research (DYOR) and consult a qualified financial advisor before making any decision.
Article produced with the assistance of artificial intelligence and reviewed by the editorial team.
