

CoreWeave stock trades at a critical juncture. A $99 billion contracted backlog with Nvidia, Meta, Microsoft, and OpenAI anchors the bull case. Yet price sits below all major moving averages, creating tension between a fundamentally strong business and a technically pressured chart.
Summary
Key takeaways
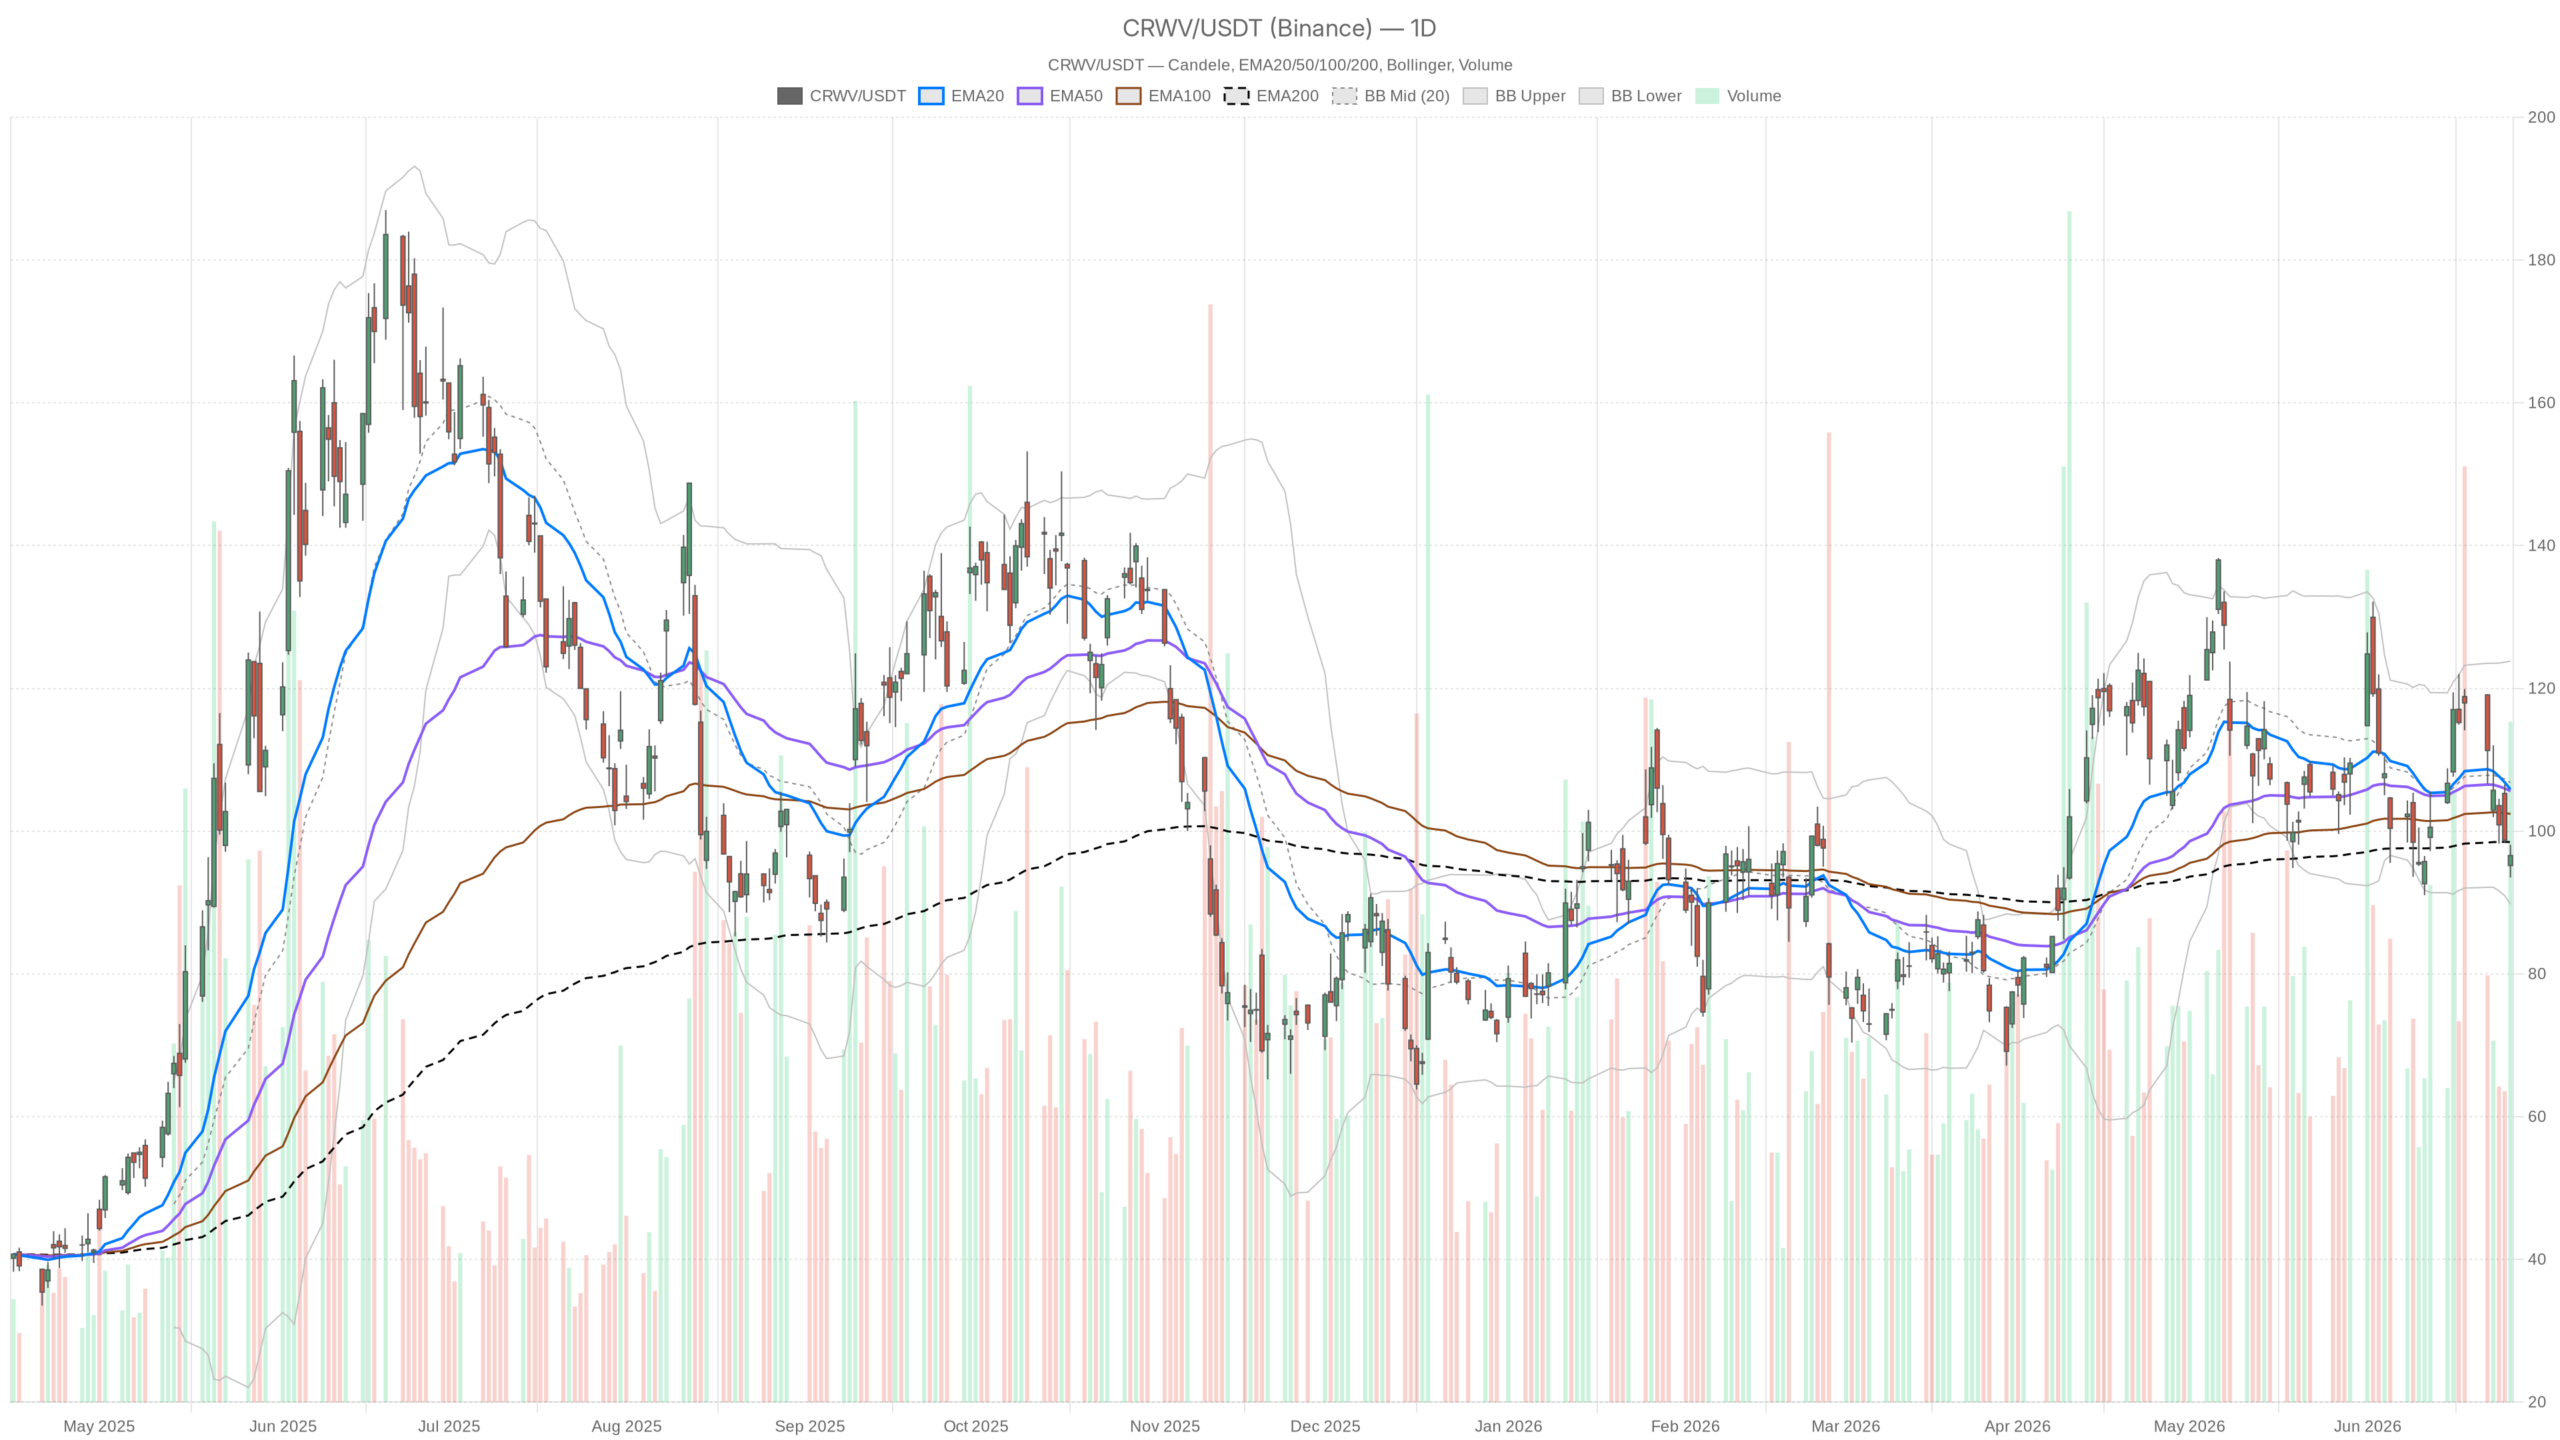
- CoreWeave stock closed at $96.58 on June 26, trading below the EMA20, EMA50, and EMA200.
- The daily RSI at 41.57 has room to fall before reaching oversold territory.
- A $99 billion contracted backlog with Nvidia, Meta, Microsoft, and OpenAI supports the long-term bull case.
- The daily ATR of $8.27 signals elevated volatility, with $10–12 moves normal across a few sessions.
- Key levels: reclaim $98.47 (EMA200) for bullish validation; failure exposes $94.02 support and the $89.77 lower Bollinger Band.
Daily Technical Structure: CoreWeave Stock Below Key Moving Averages
CoreWeave stock is trading beneath all three major exponential moving averages on the daily chart — a configuration that historically favors sellers. On the daily timeframe, CRWV closed at $96.58 on June 26. It sits below the EMA20 ($105.85) and EMA50 ($105.61), which have converged into a ceiling near $105. The EMA200 rests at $98.47, just above the current close. When price trades below all three major averages, the path of least resistance has historically pointed downward.
Momentum Indicators Signal Further Downside Risk
Momentum readings confirm the bearish lean without yet signaling exhaustion. The daily RSI sits at 41.57 and has not reached oversold territory. That is a concern, not a comfort — it implies room to fall further before a technically meaningful bounce materializes. Meanwhile, the MACD reinforces the deterioration. The MACD line at -1.61 sits below the signal line at -0.66, with a negative histogram of -0.95. Momentum still points downward, and no reversal cross is in sight.
Volatility and Pivot Context
High volatility and proximity to pivot support define the near-term trading environment. Bollinger Bands show the midline at $106.79 and the lower band at $89.77. Current price presses toward the lower half of the band structure. That positioning confirms the stock has lost ground relative to its recent mean. The daily ATR of $8.27 underscores a high-volatility regime where wide daily ranges are the norm.
Pivot analysis places the pivot point at $96.06, resistance R1 at $98.61, and support S1 at $94.02. CRWV closed marginally above the pivot. However, the broader context of below-average momentum and declining EMAs makes that proximity more neutral than bullish. The real test is whether buyers reclaim $98.61 and push toward the $105 moving-average cluster.
Hourly and Intraday Timeframes Deepen Bearish Signal
Shorter timeframes amplify the bearish pressure on CoreWeave stock, though a minor intraday stabilization attempt is visible. The full picture across hourly and 15-minute charts leaves little room for immediate bullish conviction.
Hourly Chart: Textbook Distribution Pattern
The H1 regime is explicitly bearish. Price ($96.42) trades below the EMA20 ($99.09), EMA50 ($103.42), and EMA200 ($106.80). That full stack of declining averages above price signals a textbook distribution pattern. The hourly RSI at 36.65 approaches oversold territory, which could fuel short-term bounces.
Meanwhile, the hourly MACD line at -3.15 sits against the signal line at -3.21. The histogram has barely turned positive at 0.05. That minor uptick is the only constructive hourly signal. It hints at stabilization but remains far too early to interpret as a trend reversal.
15-Minute Chart: Intraday Bounce Lacks Structural Weight
On the 15-minute chart, the tone shifts. The regime reads neutral, and the RSI at 52.2 sits back above the midpoint. Intraday sellers appear to have paused. The 15m MACD histogram at 0.32 is positive, signaling short-term upward momentum. However, price remains below the EMA200 on this frame ($103.27). The intraday recovery carries no structural weight. The 15-minute chart is best used as a timing tool, not a thesis driver. The current read suggests a minor bounce attempt that lacks the depth to challenge the bearish hourly setup.
Bullish Case: $99 Billion Backlog and Analyst Conviction
The bullish thesis for CoreWeave stock rests on an extraordinarily large contracted backlog and sustained analyst confidence despite recent price weakness. The $99 billion backlog is not speculative. It involves binding contracts with some of the most capital-heavy AI spenders globally. BNP Paribas has flagged CRWV as a key AI infrastructure beneficiary in the Vera Rubin chip cycle. Cantor Fitzgerald maintained its Overweight rating with a $167 price target as recently as mid-June — nearly 73% above current prices. The European expansion into Stockholm, powered by NVIDIA hardware and renewable energy, adds geographic diversification to the revenue base.
If buyers step in and price reclaims the EMA200 at $98.47 on a sustained daily close, that would be the first meaningful technical validation that the selloff is exhausted. A push through $105 — where the EMA20 and EMA50 converge — would shift the daily bias decisively back to bullish.
Bearish Scenario: Technical Support Levels Under Threat
The bearish case for CoreWeave stock hinges on failing to hold the EMA200, which would expose deeper support levels. Daily S1 support sits at $94.02. The lower Bollinger Band rests at $89.77. A failure to hold the EMA200 at $98.47 on a closing basis would expose both as realistic near-term targets. The daily RSI has room to fall further toward oversold without triggering a mechanical reversal.
At the same time, if the broader market turns risk-off or AI infrastructure capex narratives soften, CRWV’s high-beta profile and still-elevated valuation could amplify downside quickly. The daily ATR of $8.27 means a $10–12 move in either direction across a few sessions is entirely within normal range.
CoreWeave Stock Outlook: Key Levels and Multi-Timeframe Conflict
CoreWeave stock remains in a high-uncertainty zone, with $98.47 on the upside and $94.02 on the downside serving as the decisive near-term thresholds. A clear multi-timeframe conflict is unfolding: the daily chart is neutral-to-bearish, the hourly is explicitly bearish, and the 15-minute shows an emerging intraday bounce. Notably, CRWV sank 12.4% in a single week, partly attributed to index inclusion mechanics. That kind of forced selling creates damage that takes time to repair.
The fundamental setup supports a long-term bullish view: $99 billion in contracted AI workloads, blue-chip clients, and aggressive analyst price targets. Technically, however, the stock needs to rebuild its structure before that narrative can drive price action with conviction. Positioning should account for the elevated volatility environment. Until a key level breaks definitively, CRWV stays suspended between a compelling business story and a pressured chart.
FAQ
What is CoreWeave’s contracted backlog worth?
CoreWeave holds a $99 billion contracted backlog with major clients including Nvidia, Meta, Microsoft, and OpenAI. These binding contracts provide substantial long-term revenue visibility for the AI infrastructure provider.
What are the key technical levels for CoreWeave stock?
The EMA200 at $98.47 is the critical resistance to reclaim. Daily S1 support sits at $94.02, and the lower Bollinger Band at $89.77 serves as deeper support. A push above $105 — where the EMA20 and EMA50 converge — would shift the daily bias back to bullish.
Why did CoreWeave stock drop 12.4% in a single week?
The decline has been partly attributed to index inclusion mechanics, a type of forced selling that can create significant technical damage regardless of the fundamental business outlook.
What is the analyst price target for CoreWeave?
Cantor Fitzgerald maintained an Overweight rating with a $167 price target as recently as mid-June, representing nearly 73% upside from current trading levels.
Disclaimer: This article is for informational purposes only and does not constitute financial advice, an investment recommendation, or a solicitation to buy or sell any financial instrument or cryptocurrency. The analysis provided is not indicative of future results. Investing in crypto assets and financial markets carries a high risk of capital loss. Always do your own research (DYOR) and consult a qualified financial advisor before making any decision.
Article produced with the assistance of artificial intelligence and reviewed by the editorial team.