

Tesla Stock hovers at a technical crossroads after closing at $404.66 on June 16. Down 1.58% and underperforming the broader market, TSLA sits in a fragile neutral zone. The daily trend has softened without breaking down decisively — and that tension demands attention.
Summary
Key takeaways
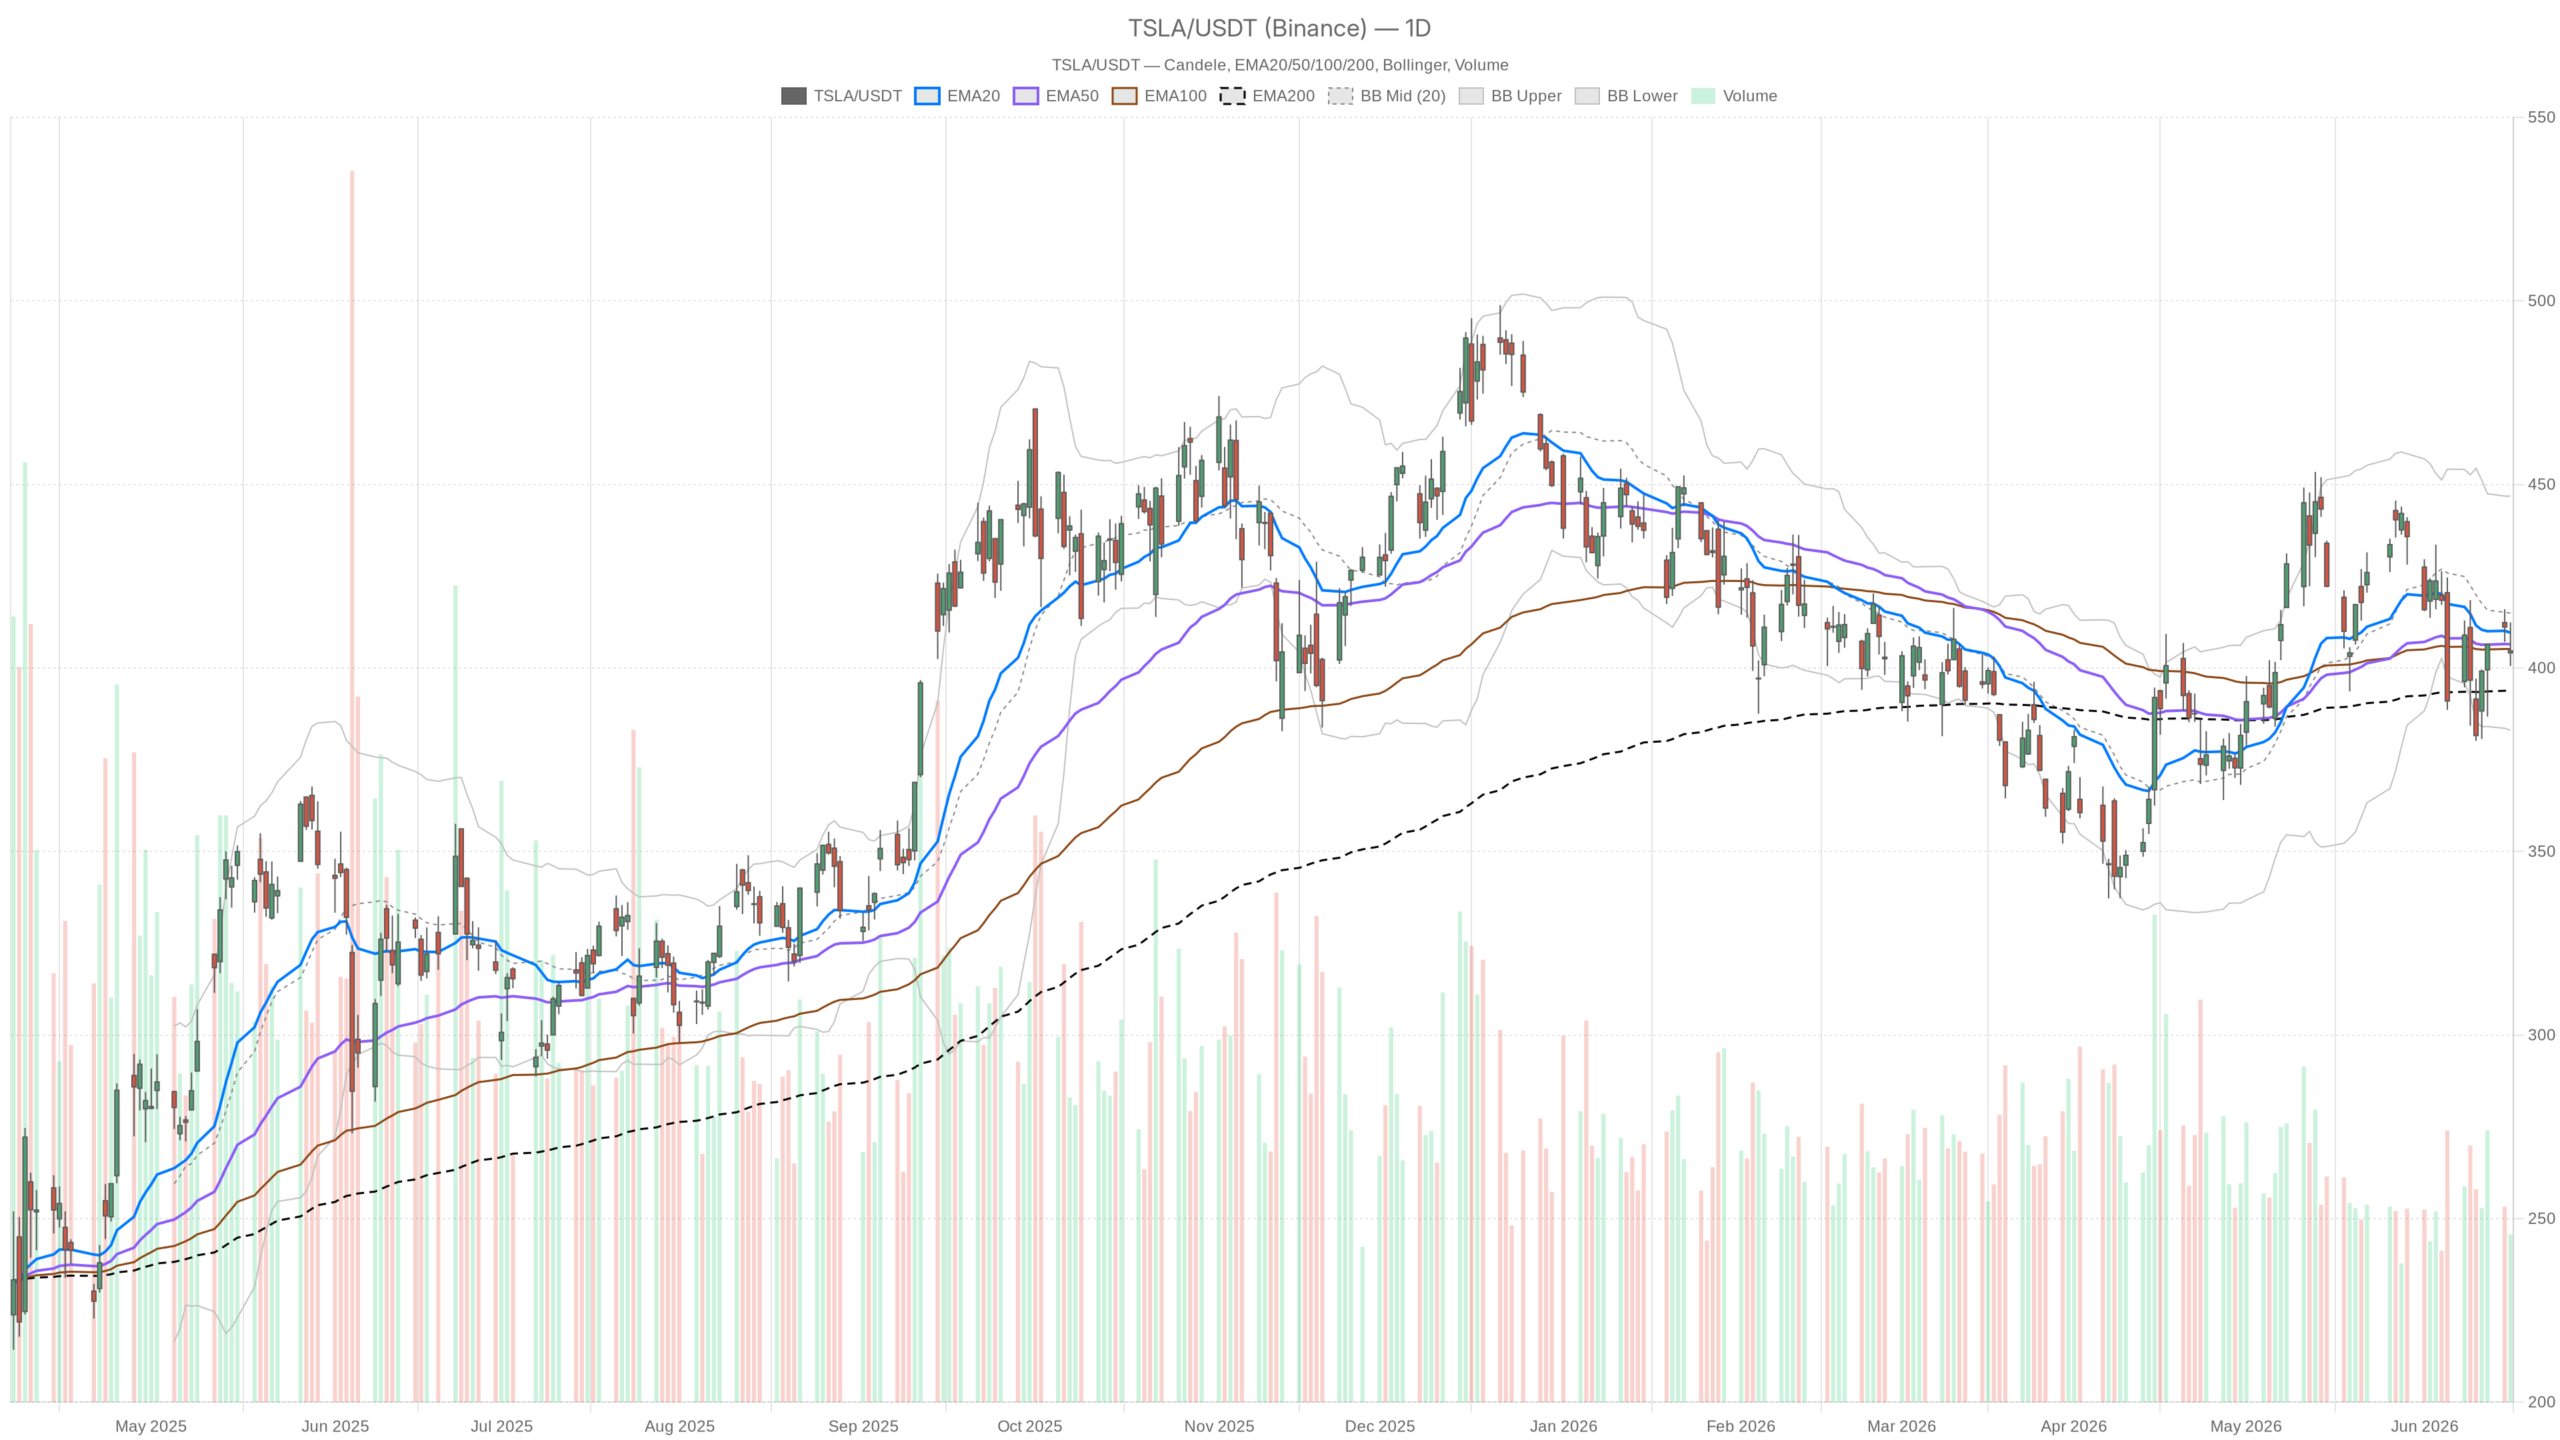
- TSLA closed at $404.66 on June 16, down 1.58% and below both the EMA20 ($409.60) and EMA50 ($406.45).
- The daily MACD has registered a bearish crossover, with the histogram at -2.62 signaling building selling pressure.
- Daily RSI at 48.22 sits just below neutral, offering no exhaustion-based floor for buyers.
- JPMorgan recently upgraded Tesla to Neutral with a $475 price target, providing a sentiment floor beneath the stock.
- A break below $400 would open the door toward $393–$395, where the EMA200 provides structural support.
Daily Technical Outlook for Tesla Stock
Tesla Stock’s daily chart reveals a bearish lean, with price slipping below both key short-term moving averages while the MACD confirms active selling pressure. The longer-term structure remains intact — the EMA200 at $393.89 sits well below current price — but near-term momentum has clearly deteriorated.
Moving Averages Signal Stalled Recovery
TSLA now trades below the EMA20 at $409.60 and the EMA50 at $406.45. Closing beneath both references on a daily basis signals that the recovery momentum which carried shares higher has stalled. The EMA200 at $393.89 still offers structural support far below. However, the breach of the two nearer averages indicates short-term trend erosion.
MACD Confirms Building Selling Pressure
Daily MACD readings reinforce the bearish case. The MACD line sits at -1.87, below the signal line at 0.76, with a histogram reading of -2.62. This clear bearish crossover shows the divergence between line and signal widening. It confirms that selling pressure is building — not merely producing a one-session blip.
RSI and Bollinger Bands Offer No Support Floor
At 48.22, the daily RSI sits just below the neutral midpoint of 50. Combined with the bearish MACD, this suggests buyers are not in control. Crucially, the stock is not oversold. No technical floor exists based on exhaustion. Meanwhile, Bollinger Bands show the midline at $414.92 — above current price. TSLA has slipped into the lower half of the band. The lower boundary sits at $383.04, while the upper reaches $446.81. The ATR14 at $17.79 confirms meaningful daily swings remain possible.
Pivot Analysis Places TSLA on the Defensive
Daily pivot analysis places the pivot point at $405.87, with R1 at $411.21 and S1 at $399.33. Closing at $404.66 puts Tesla Stock just below the daily pivot. This marginal but meaningful signal confirms the session ended on the defensive side of the structure.
Hourly Chart Shows Tentative Stabilization
Tesla Stock’s 1-hour chart offers a slightly more constructive picture — but not enough to override the daily pressure. The hourly EMA20 at $404.42 and EMA50 at $403.71 both sit below price at the close. This suggests very short-term momentum has stabilized. However, the 1H EMA200 at $409.08 remains overhead and still acts as resistance. Price has not reclaimed that level, keeping the medium-term hourly structure in a downward lean.
Turning to the 1H MACD, readings appear mixed. The MACD line at 2.05 remains positive, but the signal line at 2.55 is ahead of it. This produces a histogram of -0.50. The crossover is bearish at the hourly level, though the line itself has not gone negative. In other words, hourly momentum is decelerating — not collapsing. The 1H RSI at 51.83 sits fractionally above neutral and provides no directional conviction. On balance, the 1H chart neither confirms a bullish reversal nor accelerates the daily bearish thesis. It reflects a market that is pausing rather than pivoting.
15-Minute Compression Hints at an Imminent Move
Tesla Stock’s 15-minute chart shows a market coiling tightly. The RSI at 44.29 dips toward oversold territory on this short timeframe, while the MACD histogram at +0.13 shows a faint attempt at stabilization. Price is sandwiched between Bollinger Bands narrowing to an upper of $407.03 and lower of $403.96. This unusually tight band suggests very low immediate volatility and a potential compression setup. The ATR14 at just $1.57 confirms the short-term range has contracted sharply. This context matters for execution, not for directional bias.
Fundamental Backdrop Keeps Tesla Stock Supported
Despite technical fragility, Tesla Stock benefits from a meaningful institutional re-rating. On June 5, JPMorgan upgraded TSLA from Underweight to Neutral and lifted its price target to $475 — a dramatic revision from the prior $145 target. This likely provides a sentiment floor for the stock. Tesla has also gained roughly 27% over the past year, keeping longer-term holders in a comfortable position.
Still, the analyst community remains split. Fair value estimates have been nudged higher to around $420.55 per share. Yet Seeking Alpha contributors argue the valuation looks stretched relative to traditional automotive fundamentals. The debate between AI-driven premium and core auto-sector comparables remains unresolved. Additionally, Tesla and Argentina’s YPF are reportedly exploring an energy infrastructure partnership. This early-stage development signals continued diversification into energy — a narrative some investors view as supportive of a longer-term re-rating thesis.
Bullish Scenario for Tesla Stock
Tesla Stock can stage a recovery if it reclaims key levels. A push back above the daily EMA50 at $406.45 and through R1 at $411.21 would open the path toward $411–$412. Sustaining a hold above the EMA20 at $409.60 would shift daily momentum back to neutral-to-bullish territory. The JPMorgan upgrade to a $475 target sets a credible medium-term upside anchor. Should the AI and autonomy narrative regain traction among institutional buyers, the stock could realistically challenge the upper Bollinger Band near $446.
Bearish Scenario for Tesla Stock
On the downside, Tesla Stock faces clear risks. A failure to reclaim the daily pivot at $405.87 keeps the stock vulnerable to testing S1 at $399.33. Breaking below $400 — psychologically and technically significant — would open the door toward $393–$395. That zone aligns with the EMA200, which provides the next structural support. If the daily MACD deterioration deepens further, it would confirm the current weakness extends beyond a one-session pullback. Valuation skeptics pointing to stretched auto fundamentals represent a persistent headwind. This could amplify any broader market weakness.
Positioning Outlook for Tesla Stock
Overall, Tesla Stock sits in a technically fragile neutral zone. The daily timeframe carries a bearish lean, with the MACD remaining the most concerning signal. The RSI has not collapsed, but it has not recovered either. The 1H chart suggests brief stabilization — not reversal. Meanwhile, the 15m compression may resolve in either direction. A macro catalyst or a break through the $403–$407 range would likely serve as the trigger. Volatility via the daily ATR remains elevated enough that position sizing matters considerably. This is not a moment for high-conviction directional bets. It is a moment for patience, precise levels, and respect for the uncertainty the data clearly expresses.
FAQ
Is Tesla Stock in a bearish trend right now?
The daily timeframe for Tesla Stock is officially neutral, but momentum evidence leans bearish. TSLA closed below both the EMA20 and EMA50, and the daily MACD shows a bearish crossover with a negative histogram. However, the EMA200 at $393.89 remains well below current price, meaning the longer-term structural uptrend has not reversed.
What is the key support level for TSLA?
The nearest support sits at S1, or $399.33. A break below the psychologically significant $400 level would likely trigger a test of $393–$395. That zone aligns with the daily EMA200 at $393.89, which represents the next structural support for Tesla Stock.
What upside potential does Tesla Stock have?
If Tesla Stock reclaims the EMA50 at $406.45 and pushes through R1 at $411.21, a recovery toward $411–$412 becomes feasible. JPMorgan’s $475 price target provides a credible medium-term anchor. Should institutional buying return on the AI and autonomy narrative, the upper Bollinger Band near $446 becomes a realistic challenge.
Why did JPMorgan upgrade Tesla Stock?
JPMorgan upgraded Tesla from Underweight to Neutral on June 5, raising the price target from $145 to $475. The dramatic revision reflects a significant institutional re-rating, likely tied to Tesla’s AI and autonomy narrative rather than traditional automotive fundamentals alone.
Disclaimer: This article is for informational purposes only and does not constitute financial advice, an investment recommendation, or a solicitation to buy or sell any financial instrument or cryptocurrency. The analysis provided is not indicative of future results. Investing in crypto assets and financial markets carries a high risk of capital loss. Always do your own research (DYOR) and consult a qualified financial advisor before making any decision.
Article produced with the assistance of artificial intelligence and reviewed by the editorial team.