

Roblox stock staged a sharp recovery on June 16, closing at $49.34 after a brutal post-earnings selloff. RBLX now tests critical resistance at the EMA50. Engagement catalysts are fueling momentum — but the next few sessions will define whether this is a genuine reversal or an overextended rally.
Summary
Key takeaways
- RBLX closed at $49.34 on June 16, surging from an open of $45.90 in a high-volatility session.
- Daily RSI at 58.83 leaves room to run, but hourly RSI at 82.44 warns of near-term consolidation risk.
- Russia’s access restoration and a 10% week-over-week engagement surge are driving fundamental momentum.
- The EMA50 at $49.14 and the R1 pivot at $50.81 form the immediate resistance zone.
- A daily ATR of $2.50 means single-session swings spanning full pivot ranges are normal.
Roblox Stock Price Action — Where Is RBLX Trading Now?
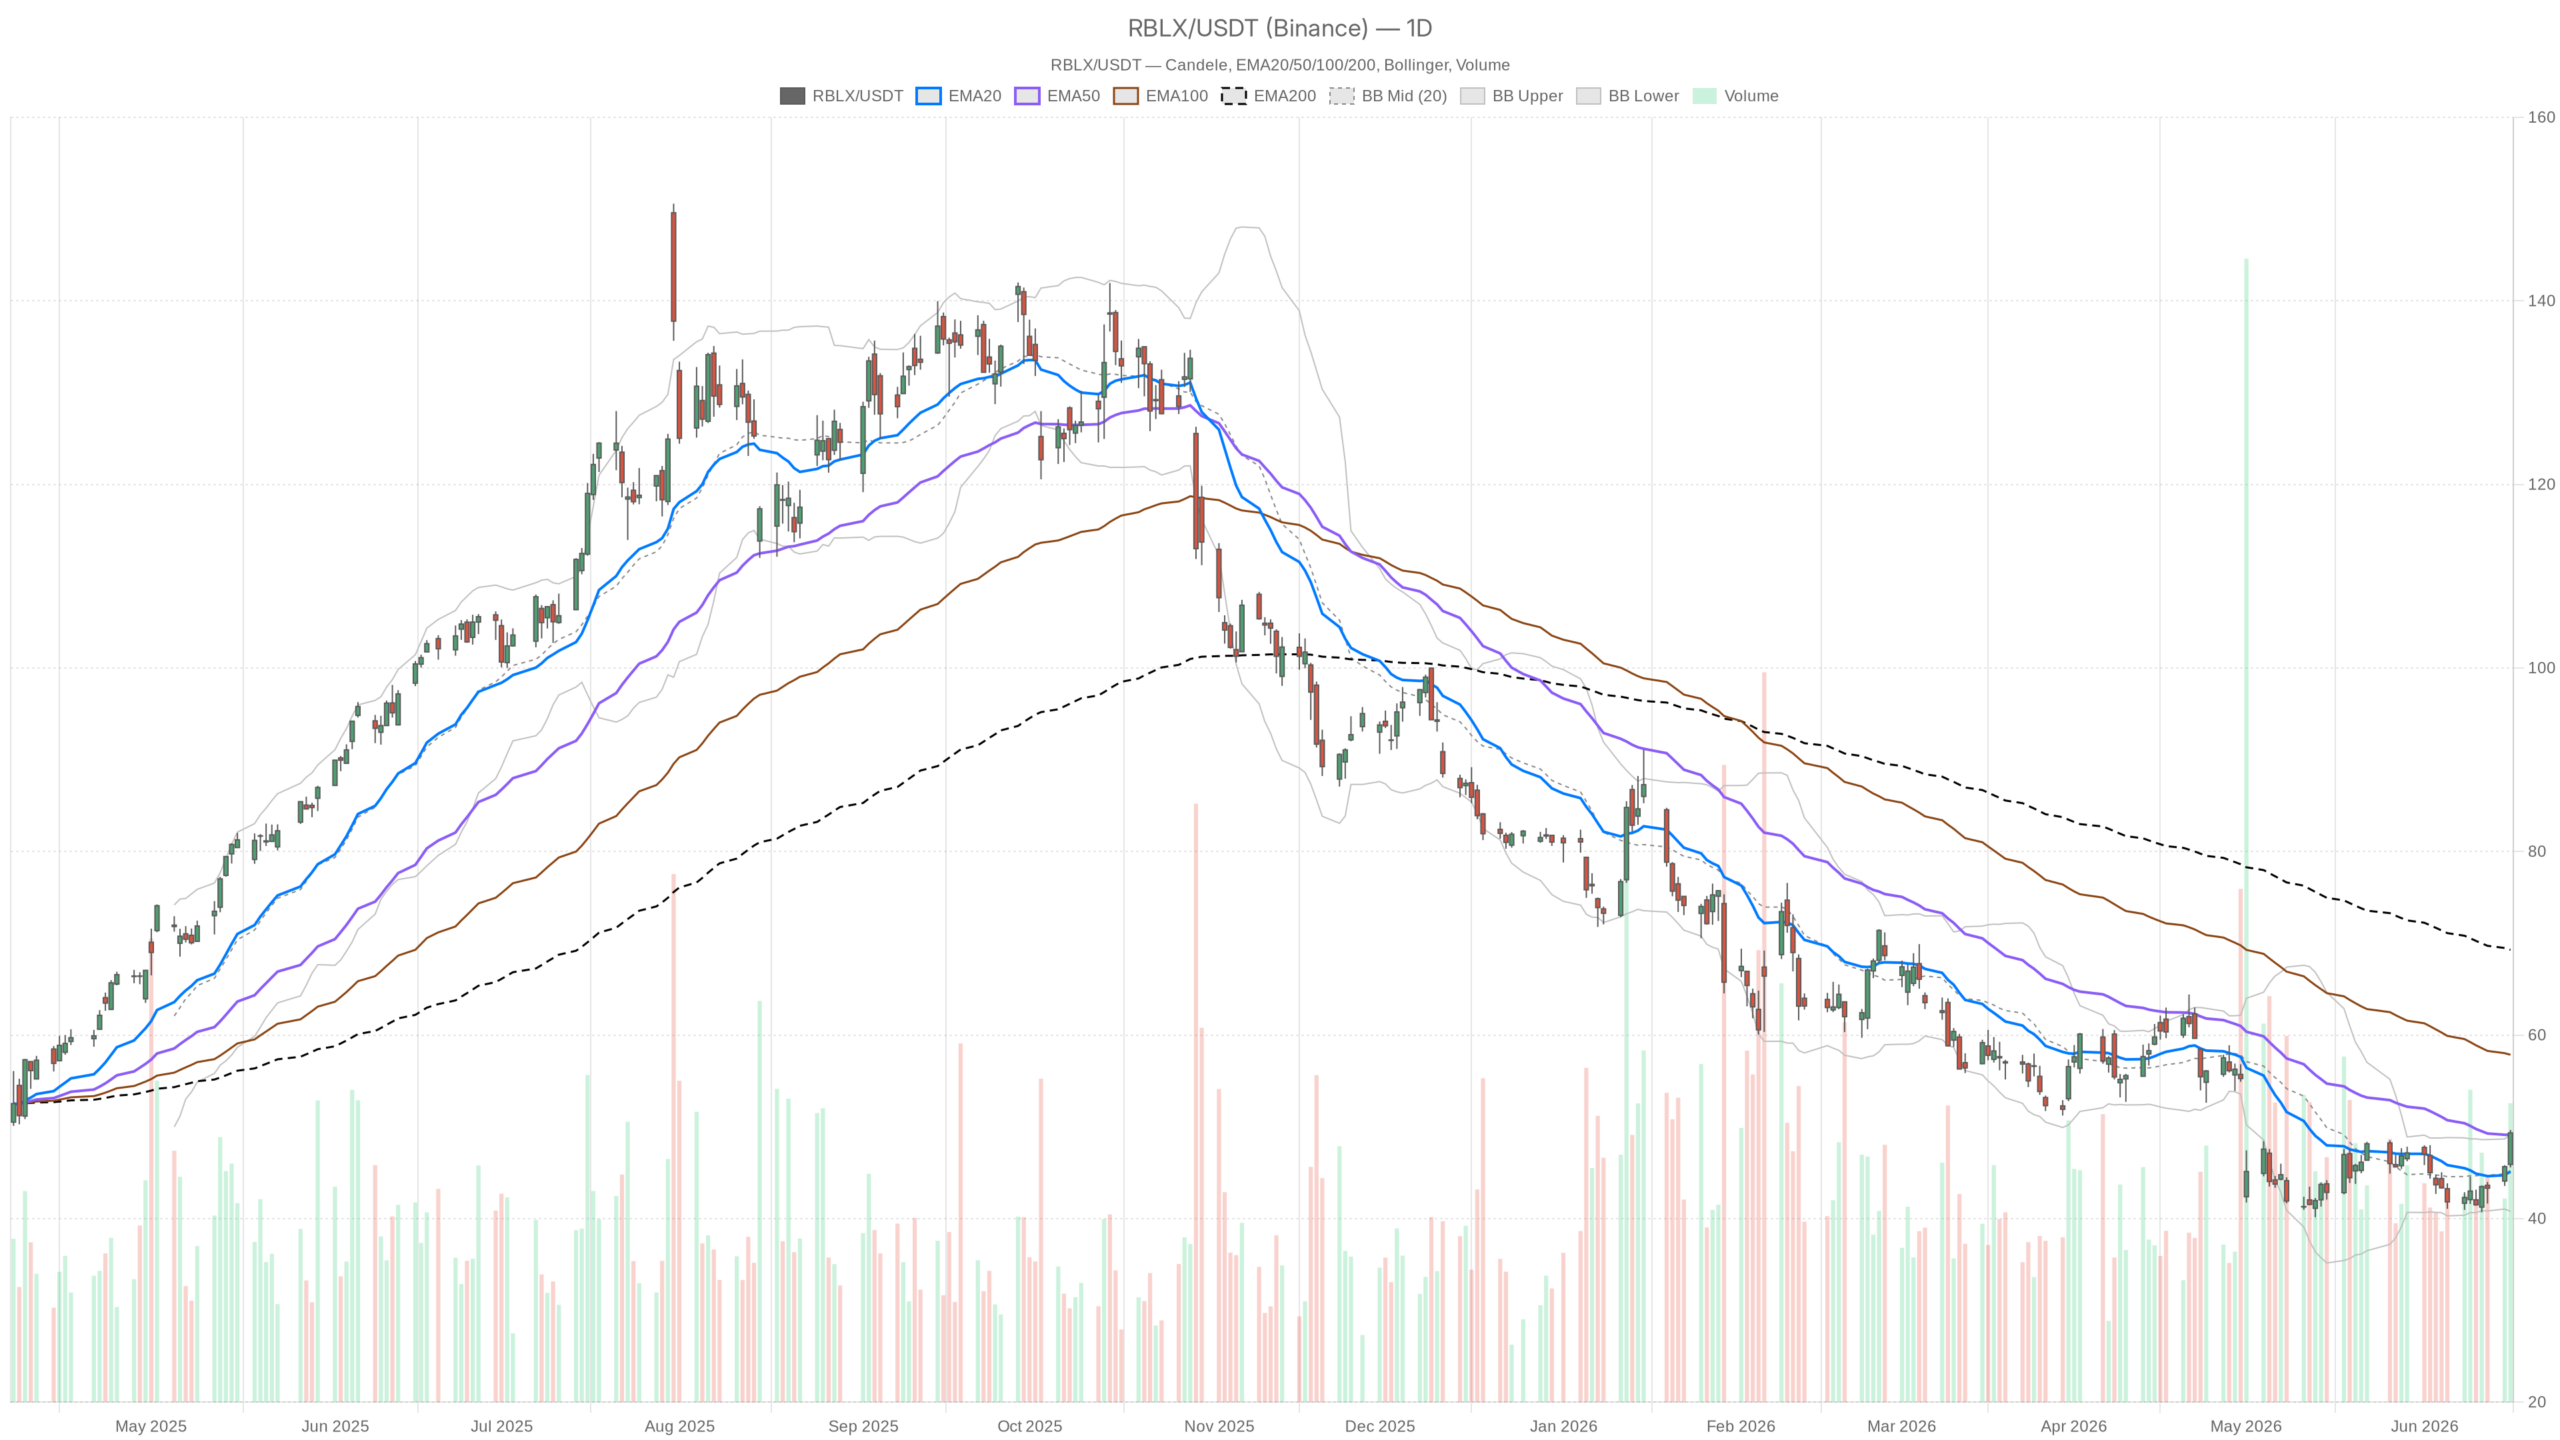
RBLX closed at $49.34 on June 16, surging sharply from a $45.90 open. The stock has pushed decisively above the EMA20 at $45.16 and is now testing the EMA50 at $49.14 from below. That close — essentially on top of the moving average — marks a meaningful technical development.
Overall, the daily timeframe sets a cautiously constructive bias. Yet the EMA200 sits far above at $69.28, a reminder of the structural damage inflicted by the prior downtrend. Roblox stock remains deep in a secular decline on the daily chart. The longer-term average is not relevant for near-term timing, but it frames the bigger picture clearly.
Daily Technical Indicators — What Are the Momentum Signals?
Momentum is improving but not yet confirmed. Daily RSI stands at 58.83 — constructive without being stretched — while the MACD crossover remains in progress, not complete. There is room to run before overbought conditions arrive.
Notably, the MACD sits at -0.94, still technically negative. Yet the histogram has flipped positive at +0.71, with the signal line at -1.65. This histogram expansion reflects accelerating upside momentum. It matters more than the absolute MACD reading right now. The crossover is developing, not finished.
Bollinger Bands add further context. The upper band sits at $49.18, and the close at $49.34 represents a marginal break above it. A sustained close above the upper band — especially with rising momentum — signals strength rather than exhaustion. Meanwhile, the mid-band at $44.98 now serves as medium-term support. The daily ATR at $2.50 confirms this remains a volatile name where large swings are normal.
Key Roblox Stock Levels — Where Are Support and Resistance?
Immediate resistance sits at $50.81 (R1), while support is layered at $48.19 (pivot) and $46.72 (S1). These levels frame the tactical battleground for RBLX in the sessions ahead.
Daily pivot analysis places the pivot point at $48.19, a level RBLX has decisively cleared. The first resistance, R1, sits at $50.81 — the next logical target in the bull case. Notably, the EMA50, the daily Bollinger upper band, and R1 near $50.81 converge into a natural ceiling. Sellers are likely to test conviction there.
In contrast, support is defined at $46.72, which aligns with the EMA20 zone. It represents the first meaningful floor on any pullback. The pivot at $48.19 now becomes the line in the sand intraday. A failure there would suggest the June 16 move was driven by short-covering rather than sustained buying.
Shorter Timeframes — Is RBLX Overextended?
Yes, the hourly RSI at 82.44 signals deeply overbought conditions. This does not kill the trend, but it argues strongly against chasing the move at current levels. The question is duration, not direction.
On the hourly chart, the trend structure is clean and unambiguous. Price trades well above the hourly EMA20 at $46.34 and EMA50 at $44.80. The hourly MACD remains firmly bullish, with the line at 1.60 well above the signal at 1.19. The histogram holds positive.
However, the 15-minute timeframe confirms cooling momentum. All three EMAs are stacked in proper order — EMA20 at $48.38, EMA50 at $46.92, EMA200 at $44.62 — with price above all of them. Yet the MACD histogram has nearly flatlined at +0.01. The 15m RSI at 74.86 is elevated but not extreme. This can signal short-term exhaustion. For execution, a minor pullback toward $49.22 support would offer a cleaner entry zone.
Fundamental Catalysts — What’s Fueling the Roblox Stock Rally?
Three catalysts are converging: Russia’s access restoration, a 10% engagement surge, and the global rollout of age-based accounts. Together they are reshaping the fundamental narrative for Roblox stock.
First, Russia’s restoration of Roblox access is a direct audience recovery play. The country had been a blocked market, and its reopening brings meaningful user base expansion potential back onto the table. Meanwhile, TD Cowen cited a 10% week-over-week engagement surge. This was driven by summer seasonality, the Russia ban reversal, and viral momentum behind Grow a Garden 2. That kind of engagement data during the summer period is material for bookings and monetization trends heading into Q2.
On top of that, Roblox announced the global rollout of age-based accounts. Roblox Kids and Roblox Select are designed to address child safety regulatory scrutiny. This is not just a PR move. Demonstrating proactive safety frameworks reduces regulatory overhang — a genuine risk factor for the platform’s operating model.
Bullish vs. Bearish Scenarios for RBLX
The bull case needs consolidation above $49; the bear case hinges on the EMA50 failing as support. Both scenarios are plausible given the overbought hourly conditions and the broader post-earnings context.
The Bullish Case
In this scenario, RBLX consolidates above $49 and uses the EMA50 as a new floor. The path toward R1 at $50.81 then opens up. A confirmed daily close above $50 would mark a meaningful psychological and technical break. Continued positive analyst commentary and further Russia engagement metrics would reinforce the case. The MACD crossover completing on the daily chart would serve as the cleaner confirmation signal.
The Bearish Case
On the other hand, the bearish scenario centers on the EMA50 failing as support. The stock closed on top of the $49.14 level — not a comfortable buffer. If sellers take control and price slips below $48.19, the pivot becomes the line in the sand. A failure there would suggest the rally was driven by short-covering. A retest of $46.72 should not be ruled out. The post-earnings context also matters: stocks that fall 24%+ often see multiple retests before establishing a durable base.
FAQ
Is Roblox stock a buy after the June 16 surge?
Positioning aggressively at current levels carries meaningful intraday risk. The hourly RSI at 82.44 is deeply overbought, and a pullback toward the $46.72–$48.19 support zone would offer a more disciplined entry. Monitoring for consolidation above the EMA50 before adding exposure is the more prudent approach.
What are the key resistance levels for RBLX?
The immediate resistance is R1 at $50.81. Above that, a confirmed daily close above $50 would mark a psychological break. The EMA50 at $49.14 and the daily Bollinger upper band at $49.18 form an initial ceiling where sellers may test conviction.
Why did Roblox stock drop so sharply before this rally?
RBLX suffered a brutal post-earnings selloff after Q1 2026 results, wiping more than 24% of its value in a single session. Stocks that experience such severe single-session declines often see multiple retests of lower levels before establishing a durable base. The current rally is testing whether that base is now in place.
Disclaimer: This article is for informational purposes only and does not constitute financial advice, an investment recommendation, or a solicitation to buy or sell any financial instrument or cryptocurrency. The analysis provided is not indicative of future results. Investing in crypto assets and financial markets carries a high risk of capital loss. Always do your own research (DYOR) and consult a qualified financial advisor before making any decision.
Article produced with the assistance of artificial intelligence and reviewed by the editorial team.