

RSI, an acronym for Relative Strength Index, is a technical indicator used in the analysis of financial markets. It can be used even in cryptocurrency trading.
It was born in 1978 when a book called “New concepts in technical trading systems” by John Welles Wilder appeared on the scene. John was a former mechanical engineer who left his job in the early 1970s to focus on the financial markets.
His objective was to create indicators based on mathematical analysis. He wanted to create a simple tool to visually represent market movements.
To date, the RSI indicator is one of the most widely used and observed indicators by cryptocurrency traders and implemented by default on most exchanges.
Summary
RSI indicator: operation in detail
The basic concept on which the indicator is based is actually quite simple. In essence, the stronger the price, the greater the upward closures of the market compared to the downward closures and exactly the opposite in times of market weakness.
RSI is classified as an oscillator that measures the speed and direction of price movements.
It is defined as a “momentum” which is nothing more than the ratio between upward and downward closures.
Contrary to other indicators, it manages to overcome some classic momentum-related problems that occur when there are abrupt movements of the market causing a sudden reversal of the trend.
It uses a band of oscillation ranging from 0 to 100. It allows a visual comparison with some predetermined constant levels that are indices of attention.
RSI is based on a simple mathematical formula that requires only one input parameter, i.e. the number of periods to be considered.
In his book, Wilder recommends 14 to get the best results.
RSI = 100 x U / (U + D)
U is the average of the upward closing differences of X days, D is the absolute average of the downward closing difference of X days.
As with all oscillators, the shorter the period used, the greater the sensitivity of the oscillator and the consequent generation of false signals.
How to make the most of it
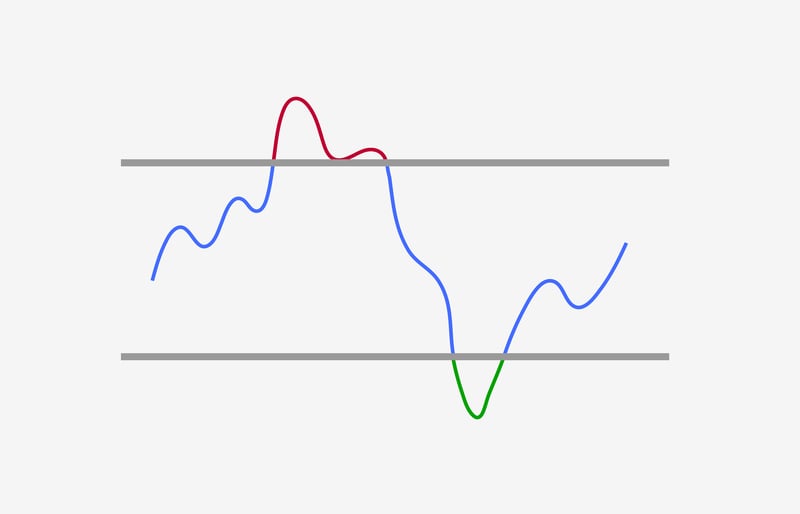
When the price moves up quickly you will enter an area that is called “overbought“. On the contrary, when the price continues to fall quickly you enter an area called “oversold“.
Wilder noticed that statistically soon after crossing these alert zones there was a reversal of the price trend. Usually, these two zones are identified by the value 70 for overbought and by the value 30 for oversold as recommended by its creator, but it is not uncommon to see implementations with values 80-20.
A cryptocurrency trader, in addition to the knowledge of candlestick analysis, can take advantage of this indicator based on the alert levels of the chart and thus can understand when it will be the best time to enter or exit the market.