




IBM Stock surged on a quantum catalyst yet remains capped below the 200-day EMA, keeping trend bias neutral. Volatility is elevated; therefore, consolidation is likely before any decisive turn.
Summary
IBM Stock: Quantum catalyst surge meets 200-day resistance
IBM spiked on policy-driven news but closed below the long-term barometer. The setup argues for digestion after the jump. Meanwhile, sentiment has reset, which supports a constructive bias if resistance yields.
Daily technical outlook: trend capped below the 200-day EMA
Momentum and volatility context
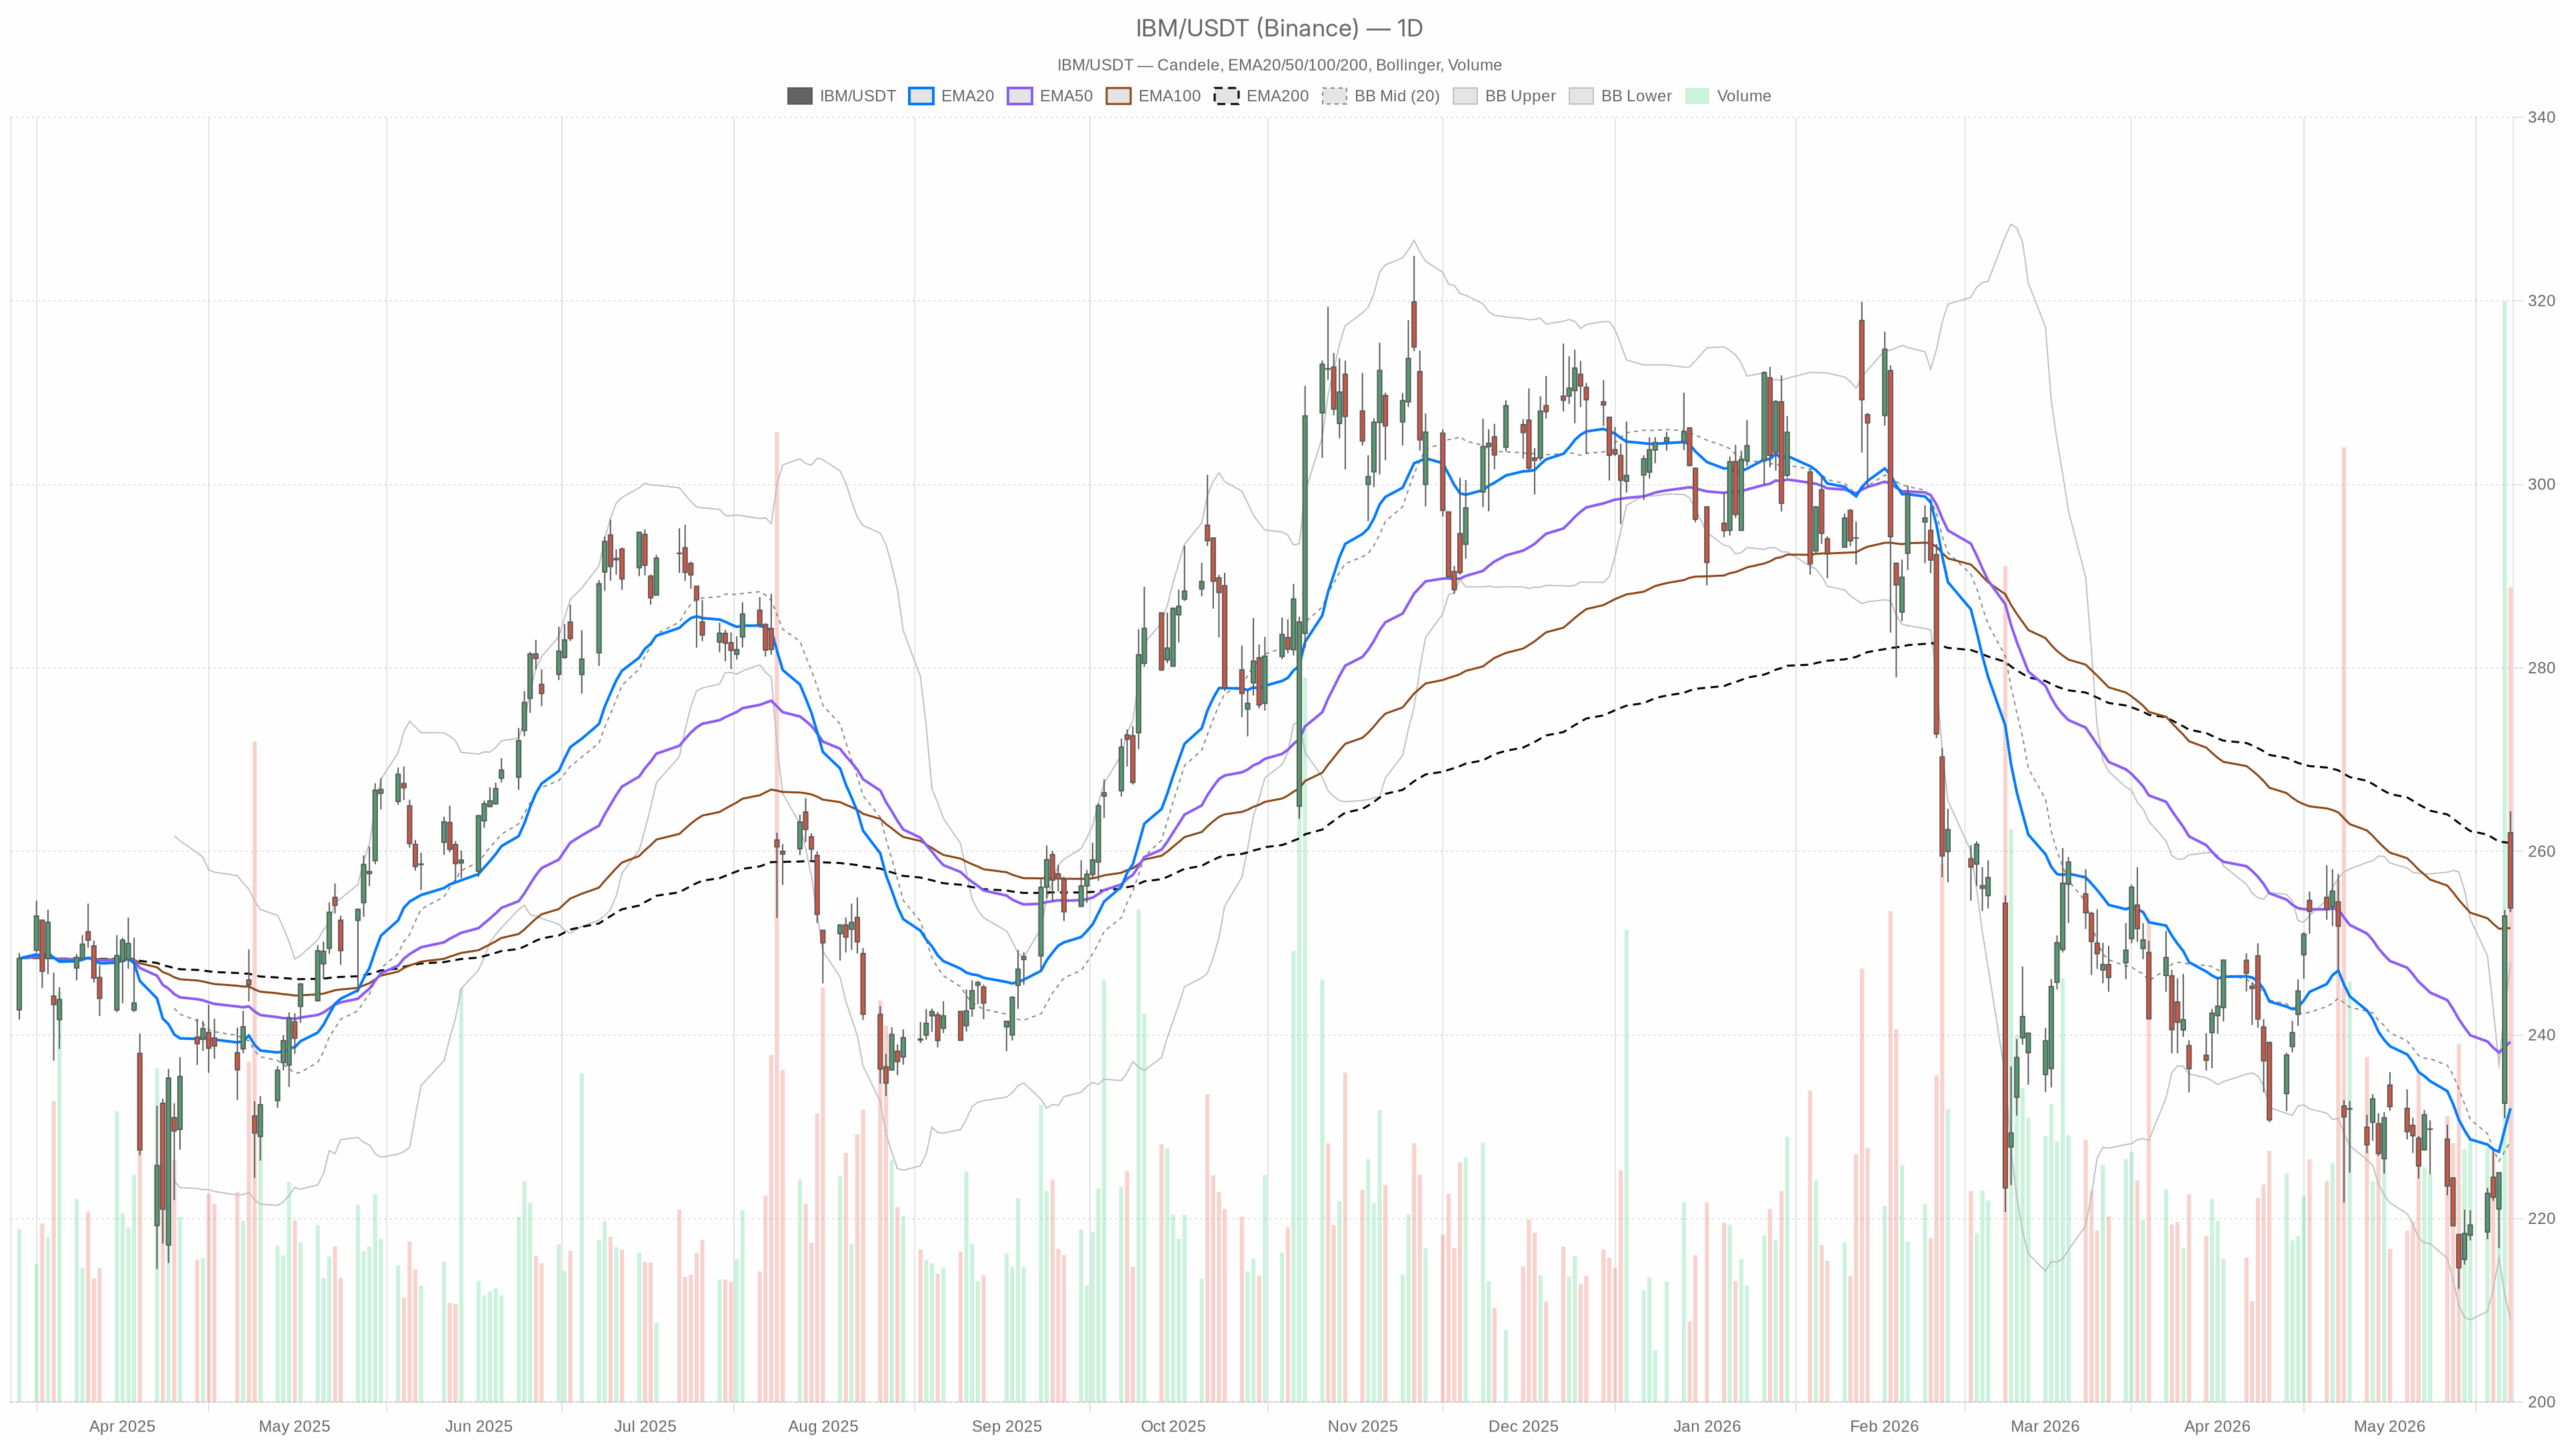
On the daily timeframe, shares closed at 253.84, above the 20-day EMA at 232.02 and the 50-day EMA at 239.28, but beneath the 200-day EMA at 260.93. This alignment signals medium-term strength while a long-term ceiling holds. The RSI(14) prints 66.02. Momentum is firm, not exhausted. Notably, price finished above the upper Bollinger Band at 247.80, a short-term stretch that often invites mean reversion or sideways action. Daily ATR(14) at 7.84 confirms expanded volatility.
Key daily levels and consolidation band
Therefore, near-term references matter. The daily pivot sits at 257.20 with R1 at 261.02 and S1 at 250.03. Resistance aligns just under the 200-day EMA, while first support sits in the low 250s. This frames a likely consolidation range between roughly 250 and 261. Holding above S1 would keep pullbacks orderly; repeated rejection near R1 would signal supply.
News catalyst: US-backed quantum foundry resets sentiment
Notably, IBM and the U.S. Department of Commerce signed a Letter of Intent to create Anderon, a quantum chip foundry funded by $1 billion in CHIPS incentives and a matching $1 billion commitment from IBM. Wedbush called the quantum investment a new industry catalyst. The news helped drive shares nearly 18% higher on the week; however, a clear break above the 200-day is still required to seal a trend change.
1H intraday structure: bullish regime, momentum cooling
Meanwhile, the 1H chart holds a bullish regime. Price is above the hourly 20/50/200 EMAs (245.70/235.15/232.38), confirming an intraday uptrend. Hourly RSI(14) at 72.88 shows hot momentum, which is prone to brief shakeouts. The hourly MACD line (8.69) is above signal (8.16) with a small positive histogram at 0.53, indicating upside pressure with waning acceleration.
Hourly Bollinger Bands center at 242.94 with the upper band at 271.00. Price trades in the upper half, aligning with strength. Hourly ATR(14) at 5.38 signals wide bars. The hourly pivot at 254.11, with R1 at 254.82 and S1 at 253.13, defines a tight near-term battleground.
15-minute context: micro pullback within the advance
At the same time, the 15-minute setup has cooled to neutral. Price sits below the 15m EMA20 at 255.22 but above the EMA50 at 249.91. This is a typical micro pullback within a higher timeframe advance. The 15m RSI(14) at 48.01 is balanced. The 15m MACD shows a negative histogram (-0.92) with line (0.88) below signal (1.80), pointing to short-term basing risk.
Price is near the lower 15m Bollinger Band at 253.69, which implies immediate support and potential stabilization. The 15m pivot at 254.01, with R1 at 254.64 and S1 at 253.23, highlights the 253.2–254.0 zone as execution-relevant.
Bias and range: consolidation likely into the next session
Overall, the daily trend is neutral with a bullish tilt, the 1H confirms near-term strength, and the 15m shows a pause. This mix argues for consolidation after a catalyst gap. Therefore, dips may find bids near 250–254, while supply likely emerges into 257–261 until resolved. Risk remains two-sided.
Bullish scenario: conditions to flip IBM Stock decisively bullish
Bullish path: a firm daily close back above the pivot at 257.20, followed by a break through 261.02 and a reclaim of the 200-day EMA at 260.93, would upgrade the trend. RSI holding in the 60s and a still-rising daily MACD histogram would support sustained momentum.
On the hourly, a hold above 254.11 with RSI cooling from overbought without breaking structure would back follow-through. In short, clearing 261 and stabilizing above it would flip the bias to bullish for IBM Stock.
Bearish scenario: failure at support deepens mean reversion
On the other hand, the bearish alternative grows if 250.03 fails on a daily close. That would likely trigger a mean-reversion move toward the prior daily upper band near 247.80, then the 50-day EMA at 239.28, and potentially the 20-day EMA at 232.02. A rolling daily MACD and RSI slipping toward the mid-50s would confirm waning momentum.
Intraday, sustained trading below the hourly S1 at 253.13 would be an early tell that sellers remain active.
Conclusion: IBM Stock outlook
IBM Stock has a credible new catalyst but remains technically capped below its 200-day average. Volatility is elevated, and timeframes are not fully aligned. Therefore, the base case is range-bound digestion between roughly 250 and 261. Until the 200-day is reclaimed, positioning should respect two-way risk and sharp swings around intraday pivots.
