




With volatility compressed and risk appetite subdued, the Dogecoin price hovers near $0.10 as traders wait for a decisive range break.
Summary
Market thesis
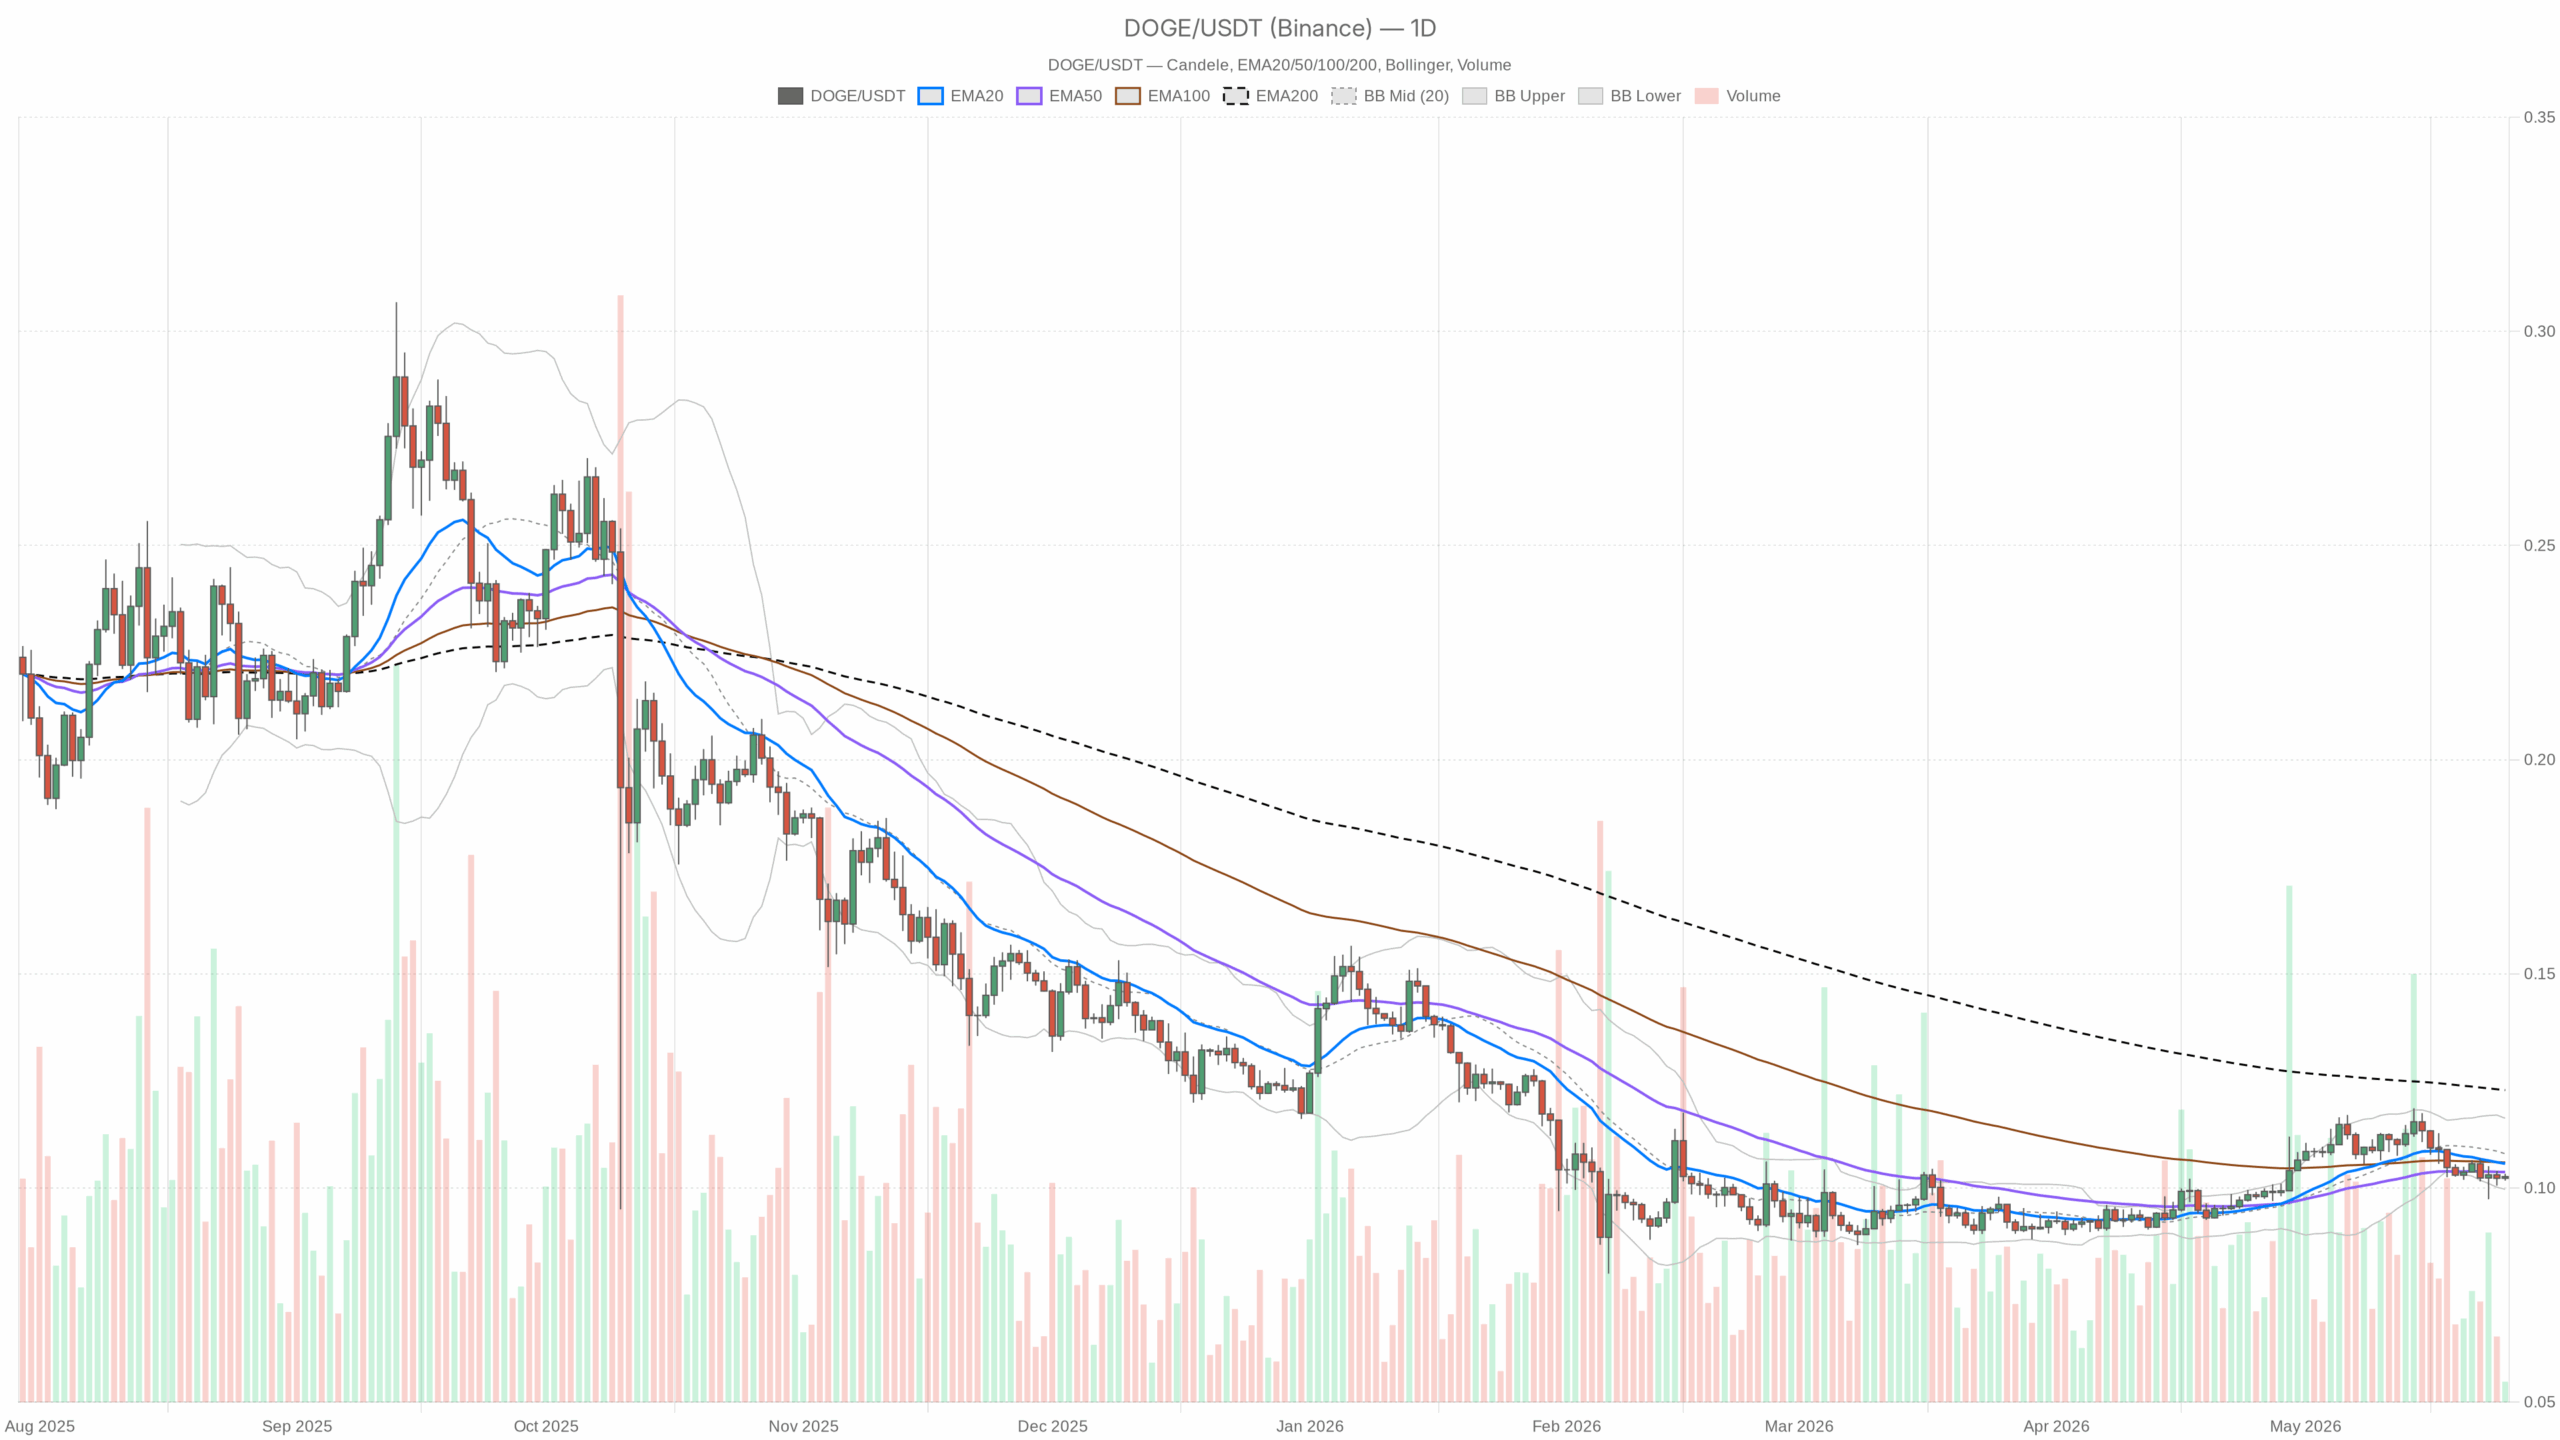
Dogecoin’s price is glued to $0.10 on the daily chart, where structure and sentiment are locking it in place. Volatility is compressed and broader crypto risk appetite is muted (Fear & Greed at 30, Bitcoin dominance above 58%). As a result, capital is hugging the defensive end of the spectrum. In that backdrop, DOGE behaves like a classic high-beta alt: capped on bounces, supported at round-number magnets.
As of 25 May 2026, price is sitting at the lower Bollinger Band while trading below key moving averages. That cocktail usually resolves in two ways. Either a relief pop toward the mid-band, or a momentum slip through support that kick-starts a volatility expansion. Until a level gives, expect range-first behavior.
Main bias (D1): Neutral, with a bearish lean. Daily structure is range-bound around $0.10, but being below the 20-day and 200-day EMAs keeps a slight downside skew. Intraday timeframes are trying to stabilize, yet they have not overturned the daily drag.
Market logic
Trend vs. mean reversion
Trend pressure is soft-bearish below the 20D and 200D EMAs. However, the tape remains boxed between $0.10 and $0.11, which favors fading extremes over chasing until a clean break. That said, a decisive break of $0.10 or a reclaim of $0.11 would likely pull the Dogecoin price out of its magnet zone.
Momentum vs. structure
Momentum is lackluster on the daily, with RSI sub-50 and MACD flat. Moreover, structure is tight as bands compress. Reclaiming the mid-band near $0.11 could open a squeeze. Conversely, losing $0.10 would likely invite expansion lower.
Risk appetite vs. defensive positioning
With Bitcoin dominance elevated and sentiment in Fear, alt rallies struggle to sustain. Therefore, without a shift in broader risk appetite, rallies into $0.11–$0.12 remain vulnerable to supply.
Indicator check (D1)
EMAs: 20D = 0.11, 50D = 0.10, 200D = 0.12 — Price below the 20D and 200D keeps a mild downtrend bias, while sitting near the 50D highlights indecision at $0.10.
RSI(14): 44.3 — Sub-50 momentum favors sellers on the daily; bulls need a push back above 50 to reset the tone.
MACD: Line ≈ 0, Signal ≈ 0, Hist ≈ 0 — Momentum is flat; no active trend impulse from this gauge.
Bollinger Bands: Mid = 0.11, Upper = 0.12, Lower = 0.10 — Price hugging the lower band signals pressure but also the risk of a snapback toward the mid-band if sellers tire.
ATR(14): ≈ 0 — Realized volatility is compressed; expect a sharper move once $0.10 or $0.11 breaks.
Pivots: PP = 0.10, R1 = 0.10, S1 = 0.10 — The market is treating $0.10 as a magnet; breaks away from this gravity point should carry more significance.
Lower timeframes
Meanwhile, on H1, price ≈ 0.10 with EMAs stacked on top of each other; RSI 52.4. A slight intraday bid, but it is stabilization, not trend. Confirmation would require higher lows and holding above 0.11.
Additionally, on M15, price ≈ 0.10; RSI 53.0. The micro timeframe is balanced-to-firm, useful for execution around levels but not for changing the daily bias.
Scenarios and invalidation
Bullish path: A daily close back above ~0.11 (mid-band/EMA20) with H1 holding that level turns the range into a squeeze toward ~0.12 (upper band/EMA200). Follow-through improves if RSI (D1) reclaims 50 and hourly structure prints higher lows. Invalidation: a failed breakout that falls back below 0.11 on a daily close.
Bearish path: A daily close below ~0.10 (lower band/pivot cluster) accompanied by building hourly downside momentum opens volatility expansion lower. With volatility compressed, the first break can be fast. Invalidation: a swift reclaim of 0.10–0.11 that closes the day back inside the range.
Neutral/range path (main case for now): More daily closes between 0.10 and 0.11 while hourly RSI oscillates around 50 keeps mean-reversion trades in play. Invalidation: a decisive daily close beyond either boundary (above 0.11 or below 0.10).
Positioning, risk, and timing
Respect the $0.10 magnet and the compressed volatility regime. In this environment, premature breakouts often stall, and wicks can be violent once expansion begins. Many traders will prefer to let the daily candle decide: acceptance above 0.11 or rejection below 0.10. If operating intraday, let H1 lead entries and use M15 for timing.
Overall, $0.10–$0.11 defines the near-term range. A decisive daily close beyond either bound should unlock the next leg as volatility expands.
