




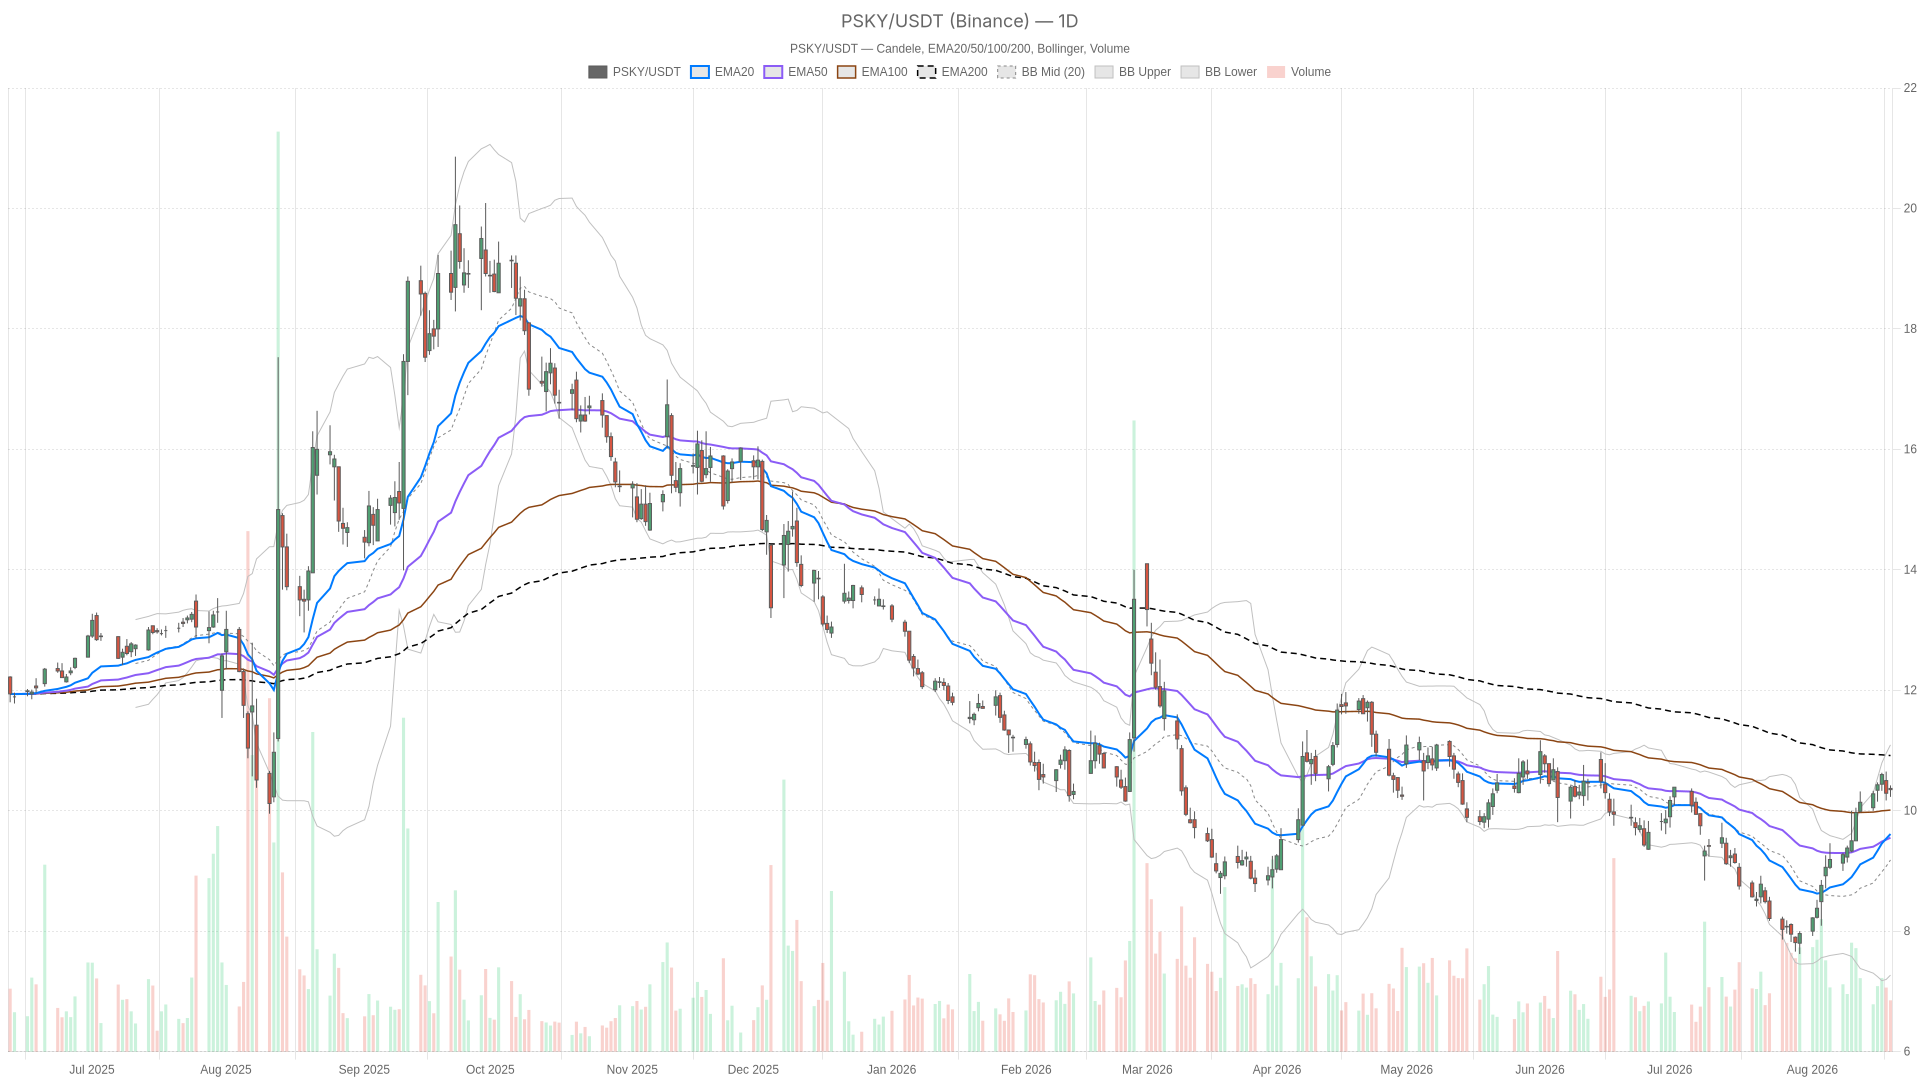
Paramount Stock shows short-term strength colliding with a longer-term ceiling. PSKY closed at $10.35, above its 20-day and 50-day EMAs, yet remains trapped below the 200-day EMA at $10.92. That gap between recovering momentum and an unresolved downtrend drives the current setup.
Summary
Key takeaways
- PSKY closed at $10.35, above the 20 EMA ($9.61) and 50 EMA ($9.55), but below the 200 EMA ($10.92)
- Daily RSI14 at 66.8 signals bullish momentum, while daily MACD remains positive with a histogram of 0.19
- The H1 timeframe shows a bullish structure, but the MACD has turned negative (-0.02), signaling momentum divergence
- The Warner Bros. Discovery merger faces antitrust review by the California Attorney General, creating binary headline risk
- Daily ATR14 at 0.42 reflects elevated volatility, while H1 ATR14 has compressed to 0.11
Paramount Stock Technical Structure: Recovery or Just a Bounce?
Paramount Stock’s technical structure shows a recovery in progress, but the broader trend has not yet flipped bullish.
Currently, on the daily chart, price sits above both the 20 EMA at 9.61 and the 50 EMA at 9.55. This configuration typically signals a shift in short-to-medium-term control toward buyers. However, the 200 EMA at 10.92 remains untouched. The system’s regime reading for the daily timeframe is tagged neutral rather than bullish. That single detail tells us the broader trend has not yet flipped, even though the near-term tape looks constructive.
Momentum readings support the recovery narrative. Daily RSI14 sits at 66.8, firmly in bullish territory and approaching levels where overbought conditions typically start to matter. The daily MACD line at 0.37 remains above its signal line at 0.17. With a positive histogram of 0.19, upward momentum is intact for now.
Meanwhile, Bollinger Bands on the daily frame show a mid-line at 9.18, with the upper band at 11.09 and the lower band at 7.27. Price has room to run before hitting the top of the range. However, it has little room before colliding with the 200 EMA resistance around 10.92. Daily ATR14 stands at 0.42, a reasonable volatility footprint for a stock caught between a merger storyline and broader macro pressure.
Pivot levels also reinforce the sense of a market at a decision point. The daily pivot is 10.33, with resistance at 10.44 and support at 10.25. Price closing right on top of that pivot underscores the indecision.
Paramount Stock Hourly Chart Confirms the Bounce, But Momentum Is Cooling
The hourly chart confirms Paramount Stock’s bounce with a bullish regime, yet momentum indicators are now stalling.
Price at 10.35 trades above the H1 20 EMA at 10.32, the 50 EMA at 10.12, and the 200 EMA at 9.43. The system tags this timeframe’s regime as bullish outright. That alignment is exactly what you would want to see if the daily recovery were about to gain traction.
Yet the momentum details tell a slightly different story. H1 RSI14 has cooled to 53.63, a neutral reading that suggests the initial push has lost steam. More tellingly, the H1 MACD line at 0.03 has slipped just below its signal line at 0.05. This produces a small negative histogram of -0.02. In other words, the hourly trend structure remains bullish, but the momentum engine behind it is stalling. This is the conflict worth flagging: trend and momentum are no longer pointing in the same direction on the same timeframe.
Meanwhile, H1 Bollinger Bands show the mid-line at 10.36, essentially where price is trading. The upper band sits at 10.59 and the lower band at 10.14. Price is consolidating near the middle of its recent range rather than pushing decisively toward either extreme. ATR14 on this timeframe has dropped to just 0.11. This confirms that intraday volatility has compressed alongside the momentum slowdown.
15-Minute Execution View: A Market Holding Its Breath
Meanwhile, zooming into the 15-minute chart, the picture is one of tight equilibrium. The 20, 50, and 200 EMAs are clustered closely together at 10.32, 10.33, and 10.11 respectively. Price sits right at 10.35. RSI14 at 54.71 points to a market with no clear short-term directional conviction. A flat MACD histogram of 0.00 reinforces that reading. ATR14 has fallen to 0.04, the lowest of the three timeframes.
The pivot at 10.35, with resistance at 10.39 and support at 10.30, shows price essentially glued to its pivot point. For execution purposes, this is a market pausing to digest recent gains rather than one preparing an immediate breakout.
The Merger Overhang Behind Paramount Stock’s Price Action
Paramount Stock’s price action cannot be fully understood without accounting for the merger-related regulatory overhang.
Technical structure alone does not explain the full picture here. Paramount is set to meet with the California Attorney General‘s office to discuss antitrust concerns tied to its proposed merger with Warner Bros. Discovery. Reports suggest Governor Gavin Newsom is open to a settlement if the terms are favorable. At the same time, Attorney General Rob Bonta has said any resolution would need robust remedies. This keeps regulatory uncertainty firmly in play.
Separately, reports have floated the possibility that Paramount Skydance could sell CNN as a way to clear regulatory hurdles for the Warner deal. These are binary, headline-driven catalysts. They can move Paramount Stock sharply regardless of what the charts say in the short term.
Adding to the backdrop, broader U.S. equity indices ended the week lower. Long-duration Treasury yields climbed for a second straight week. PSKY was specifically named among stocks in focus during that macro pressure. That combination of company-specific regulatory drama and a less favorable macro tape means technical levels here should be read with some caution.
Bullish Scenario for Paramount Stock: Reclaiming the 200 EMA
For Paramount Stock’s bullish case to gain conviction, price must clear the 200 EMA at 10.92.
First, price needs to clear the daily pivot resistance at 10.44. Then it must push decisively through the 200 EMA. A daily close above that level would mark a genuine trend shift rather than a corrective bounce. Ideally, this move would be accompanied by RSI holding above 60 without becoming extreme. MACD histogram expansion rather than contraction would provide further confirmation.
On the news side, a constructive outcome from the California AG meeting could act as the fundamental trigger. A settlement framework acceptable to both sides would give technical buyers the confidence needed to sustain a move toward the daily Bollinger upper band near 11.09.
Bearish Scenario for Paramount Stock: Rejection at Resistance
The bearish case for Paramount Stock hinges on rejection at the 200 EMA resistance near 10.92.
The bearish case rests on exactly the resistance zone currently capping price. A rejection near the 200 EMA at 10.92, with the H1 MACD histogram staying negative, would suggest the recovery is running out of fuel. RSI drifting lower on the hourly chart would reinforce that signal. A break below the daily pivot support at 10.25, and more importantly below the H1 50 EMA at 10.12, would invalidate the bullish structure. This would open the door back toward the lower portion of the daily range.
On the fundamental front, a breakdown in antitrust settlement talks could easily supply that catalyst. A more aggressive stance from California regulators would add pressure. Given how sensitive Paramount Stock currently is to merger headlines, any negative development could trigger a sharp move lower.
Closing Take: Paramount Stock at an Inflection Point
Paramount Stock sits at a genuine inflection point where technical and fundamental forces pull in opposite directions.
Overall, the daily trend is technically still neutral despite improving momentum. The hourly chart is bullish but losing steam, and the 15-minute chart shows a market simply waiting. Meanwhile, unresolved regulatory questions around the Warner Bros. Discovery deal add layers of uncertainty. The potential CNN sale and a broader macro environment pressured by rising long-duration yields further complicate the picture.
In this kind of environment, position sizing and volatility awareness matter more than chasing either scenario. A single headline from the California AG’s office could move Paramount Stock faster than any indicator on the chart.
FAQ
What is the key resistance level for Paramount Stock?
The key resistance level for Paramount Stock is the 200-day EMA at $10.92. A daily close above this level would mark a genuine trend shift from neutral to bullish.
Is Paramount Stock in a bullish or bearish trend?
Paramount Stock is technically in a neutral trend on the daily timeframe, despite short-term bullish momentum. The daily RSI14 at 66.8 and positive MACD suggest building strength, but the 200 EMA at 10.92 has not yet been reclaimed.
How does the Warner Bros. Discovery merger affect Paramount Stock?
The proposed merger creates binary headline risk for Paramount Stock. Antitrust review by the California Attorney General, the potential CNN sale, and settlement negotiations all introduce regulatory uncertainty that can move the stock sharply in either direction.
What are the key support levels to watch for PSKY?
Key support levels for PSKY include the daily pivot support at $10.25 and the H1 50 EMA at $10.12. A break below these levels would invalidate the current bullish structure and could open the door toward the lower daily range.
Disclaimer: This article is for informational purposes only and does not constitute financial advice, an investment recommendation, or a solicitation to buy or sell any financial instrument or cryptocurrency. The analysis provided is not indicative of future results. Investing in crypto assets and financial markets carries a high risk of capital loss. Always do your own research (DYOR) and consult a qualified financial advisor before making any decision.
Article produced with the assistance of artificial intelligence and reviewed by the editorial team.
