




Amylyx Pharmaceuticals, Inc. stock surged to $35.11 on August 18 after its Phase 3 LUCIDITY trial for avexitide met all endpoints in post-bariatric hypoglycemia. Volume exceeded 23.6 million shares on the stock’s best day in nearly four years. However, a concurrent $350.0 million offering complicates the outlook.
Summary
Key takeaways
- AMLX closed at $35.11 on August 18 after the Phase 3 LUCIDITY trial for avexitide met its primary and all secondary endpoints in post-bariatric hypoglycemia.
- Trading volume exceeded 23.6 million shares, in what several outlets described as the stock’s best single-day performance in nearly four years.
- Amylyx concurrently announced a $350.0 million underwritten public offering of common stock, introducing immediate dilution risk on top of an already extended rally.
- Daily RSI14 stands at 82.74, while 1H RSI14 reads 87 and 15m RSI14 hits 88.36 — all deep in overbought territory.
- The 15-minute MACD has turned negative, signaling early intraday momentum exhaustion despite the higher-timeframe bullish structure.
Daily Chart: Amylyx Pharmaceuticals, Inc. Stock in a Bullish Regime With Extreme Overbought Readings
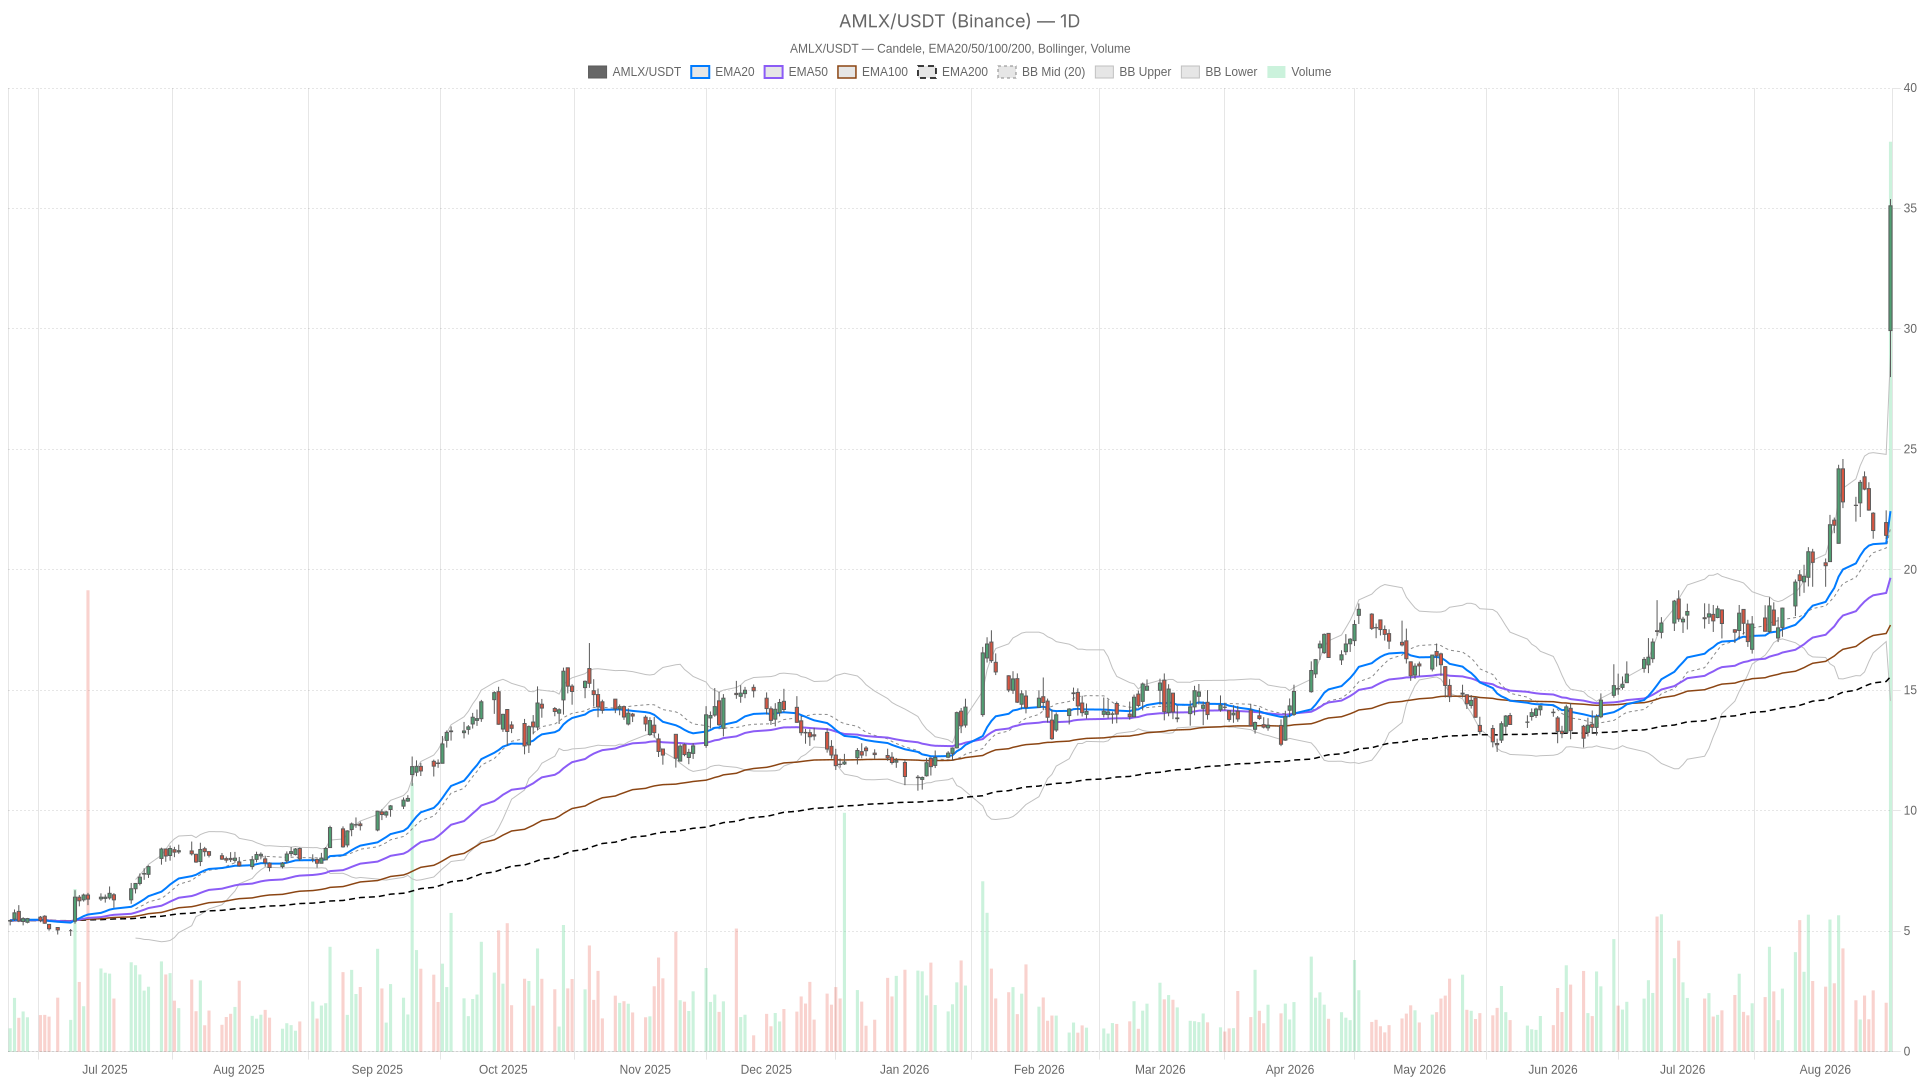
Amylyx Pharmaceuticals, Inc. stock remains in a structurally bullish trend across all major moving averages, but RSI readings above 82 and a breach of the upper Bollinger Band indicate the rally has become statistically extended.
Price is trading well above the EMA20 at 22.43, the EMA50 at 19.67, and the EMA200 at 15.56. All three moving averages are stacked in proper bullish order. This alignment confirms a strong uptrend across short, medium, and long-term horizons. The daily regime reading itself is flagged as bullish.
Overbought Momentum and Extended Range
Meanwhile, momentum has pushed into extreme territory. RSI14 sits at 82.74, well above the classic overbought threshold of 70. MACD remains constructive, with the line at 2.23 above the signal at 1.54. A positive histogram of 0.69 confirms that bullish momentum is still building rather than fading on this timeframe.
Notably, price has broken above the upper Bollinger Band at 28.92. The mid-band sits at 21.74 and the lower band at 14.56. A close outside the upper band after a sharp gap typically signals a strongly extended move — one that has outrun its normal statistical range. ATR14 at 2.38 confirms volatility has expanded meaningfully alongside the price surge.
On the pivot structure, the daily pivot point sits at 32.83, with resistance at 37.67 (R1) and support at 30.28 (S1). Price closing above the pivot and testing toward R1 shows buyers firmly in control. However, the distance already covered leaves less room before resistance comes into play.
1H Timeframe: Confirmation With Even More Extreme Readings
The one-hour chart confirms the daily bullish bias while pushing overbought readings further into unsustainable territory, with RSI14 at 87.
Meanwhile, MACD remains firmly bullish, with the line at 3.11 well above the signal at 1.76 and a wide histogram of 1.35. This indicates strong short-term momentum. The EMA20 at 27.77, EMA50 at 24.95, and EMA200 at 21.27 are all properly stacked below price, again confirming trend alignment.
At the same time, price is trading close to the upper Bollinger Band at 36.82, against a close of 35.10, with a mid-band at 25.69. That leaves more breathing room than on the daily chart, where the band has already been breached. The 1H pivot structure is notably tight: pivot at 35.03, resistance (R1) at just 35.46, and support (S1) at 34.67. This compressed range suggests the market is pausing to digest the move rather than immediately extending it. ATR14 on this timeframe stands at 1.5, still elevated relative to recent history.
15-Minute Execution Context: Early Signs of Momentum Stalling
On the 15-minute chart, RSI14 reads an extreme 88.36, and the MACD has turned negative — the earliest signal that intraday momentum is beginning to stall despite the higher-timeframe bullish structure.
Price is sitting almost exactly at the 15m pivot of 35.00, with resistance at 35.40 (R1) and support at 34.70 (S1). The immediate range is very narrow. The MACD line at 2.03 has slipped below the signal at 2.18, producing a negative histogram of -0.15. This is a subtle but real divergence from the bullish momentum still visible on the daily and 1H charts.
In other words, the short-term tape is showing the first hints of exhaustion even as the higher timeframes remain firmly bullish. This does not override the broader trend. However, it does suggest that intraday buyers may be losing some of their earlier urgency. ATR14 on the 15m chart is 0.56, consistent with the tighter, choppier price action typical of a market pausing after a large directional move.
Bullish Scenario for AMLX Stock
The bullish case for Amylyx Pharmaceuticals, Inc. stock rests on the strength of the Phase 3 LUCIDITY trial results — a substantive clinical catalyst, not a rumor-driven spike.
A Phase 3 win that met both its primary and all secondary endpoints in post-bariatric hypoglycemia is a genuine fundamental development. If price can hold above the daily pivot at 32.83 and the EMA20 at 22.43, the structural uptrend remains intact. A push through the daily R1 at 37.67 would confirm continuation.
Moreover, sustained buying interest despite the new share supply from the $350.0 million offering would signal that demand is genuinely absorbing the dilution. Retail sentiment has reportedly priced in further upside potential of nearly 70% from current levels, according to reporting on the stock’s post-earnings reaction.
Bearish Scenario and What Would Invalidate the Bullish Case
The bearish risk for AMLX stock is clear: an extremely overbought market layered on top of a major dilutive event creates real two-way vulnerability.
In this context, RSI readings above 82 on the daily, 87 on the 1H, and 88 on the 15m are not sustainable indefinitely. The negative MACD histogram forming on the 15m chart is an early warning that intraday momentum is cooling. Should selling pressure emerge — particularly as the market digests the $350.0 million offering — a pullback toward the daily EMA20 near 22.43 or the S1 support at 30.28 would be the levels to watch.
Furthermore, a break back below the 1H pivot at 35.03, combined with continued softening in the MACD histogram, would further weaken the near-term bullish case. This would hold true even if the longer-term trend structure remains technically intact.
Overall, the setup around Amylyx Pharmaceuticals, Inc. stock is one of genuine conflict between a strong fundamental catalyst and a technically overextended chart compounded by fresh dilution. Positioning here demands respect for both sides. The daily and 1H trends are unmistakably bullish, but the depth of the overbought readings across every timeframe — paired with a $350 million capital raise landing right after the rally — introduces real two-way risk. Until the market fully absorbs the new share supply and momentum indicators cool from these extreme levels, uncertainty around near-term direction should be treated as elevated.
FAQ
What drove Amylyx Pharmaceuticals, Inc. stock higher on August 18?
The Phase 3 LUCIDITY trial for avexitide met its FDA-agreed primary endpoint and all secondary endpoints in post-bariatric hypoglycemia. The result reportedly pushed shares up 14% after hours and set up what several outlets described as the stock’s best day in nearly four years.
Why is the $350.0 million offering a concern for AMLX stock?
The underwritten public offering introduces immediate dilution by increasing the share count right after a sharp rally. This creates direct tension between the genuine clinical catalyst and the capital raise, adding meaningful two-way risk to the near-term outlook.
How overbought is AMLX stock across key timeframes?
Daily RSI14 stands at 82.74, 1H RSI14 at 87, and 15m RSI14 at 88.36 — all well above the classic overbought threshold of 70. Additionally, the 15-minute MACD has turned negative with a histogram of -0.15, signaling early momentum exhaustion.
What are the key support and resistance levels to watch?
Key support sits at the daily pivot of 32.83 and S1 at 30.28, with the daily EMA20 at 22.43 acting as a deeper structural floor. Resistance stands at the daily R1 of 37.67, while the 1H pivot at 35.03 serves as the near-term reference for intraday direction.
Disclaimer: This article is for informational purposes only and does not constitute financial advice, an investment recommendation, or a solicitation to buy or sell any financial instrument or cryptocurrency. The analysis provided is not indicative of future results. Investing in crypto assets and financial markets carries a high risk of capital loss. Always do your own research (DYOR) and consult a qualified financial advisor before making any decision.
Article produced with the assistance of artificial intelligence and reviewed by the editorial team.
