



As of August 19, 2026, SOL trades at $76.83, sitting almost exactly on its daily pivot of $76.86. Solana crypto finds itself at a crossroads where short-term momentum is building a case for continuation, while the broader daily trend still carries the scars of a deeper drawdown. That tension defines the entire setup.
Summary
Key takeaways
- Solana trades at $76.83, precisely on its daily pivot of $76.86, signaling market indecision across multiple timeframes.
- The daily EMA200 sits at $89.36, more than $12 above current price, confirming the broader trend structure remains bearish.
- On-chain activity is surging: PumpSwap fees jumped 87.35% in a single day and Raydium AMM posted 30-day fee growth of 82.79%.
- The Fear & Greed Index at 46 (Fear) and Bitcoin dominance at 56.55% suggest limited risk appetite for altcoin breakouts.
In essence, the dominant force at the moment is not a clean trend. It is a tug-of-war between a recovering short-term structure and a daily chart that has not yet repaired the damage of a much larger pullback. Understanding which side wins that fight over the coming sessions is the whole game.
Daily Structure: Neutral on Paper, But the 200 EMA Tells the Real Story
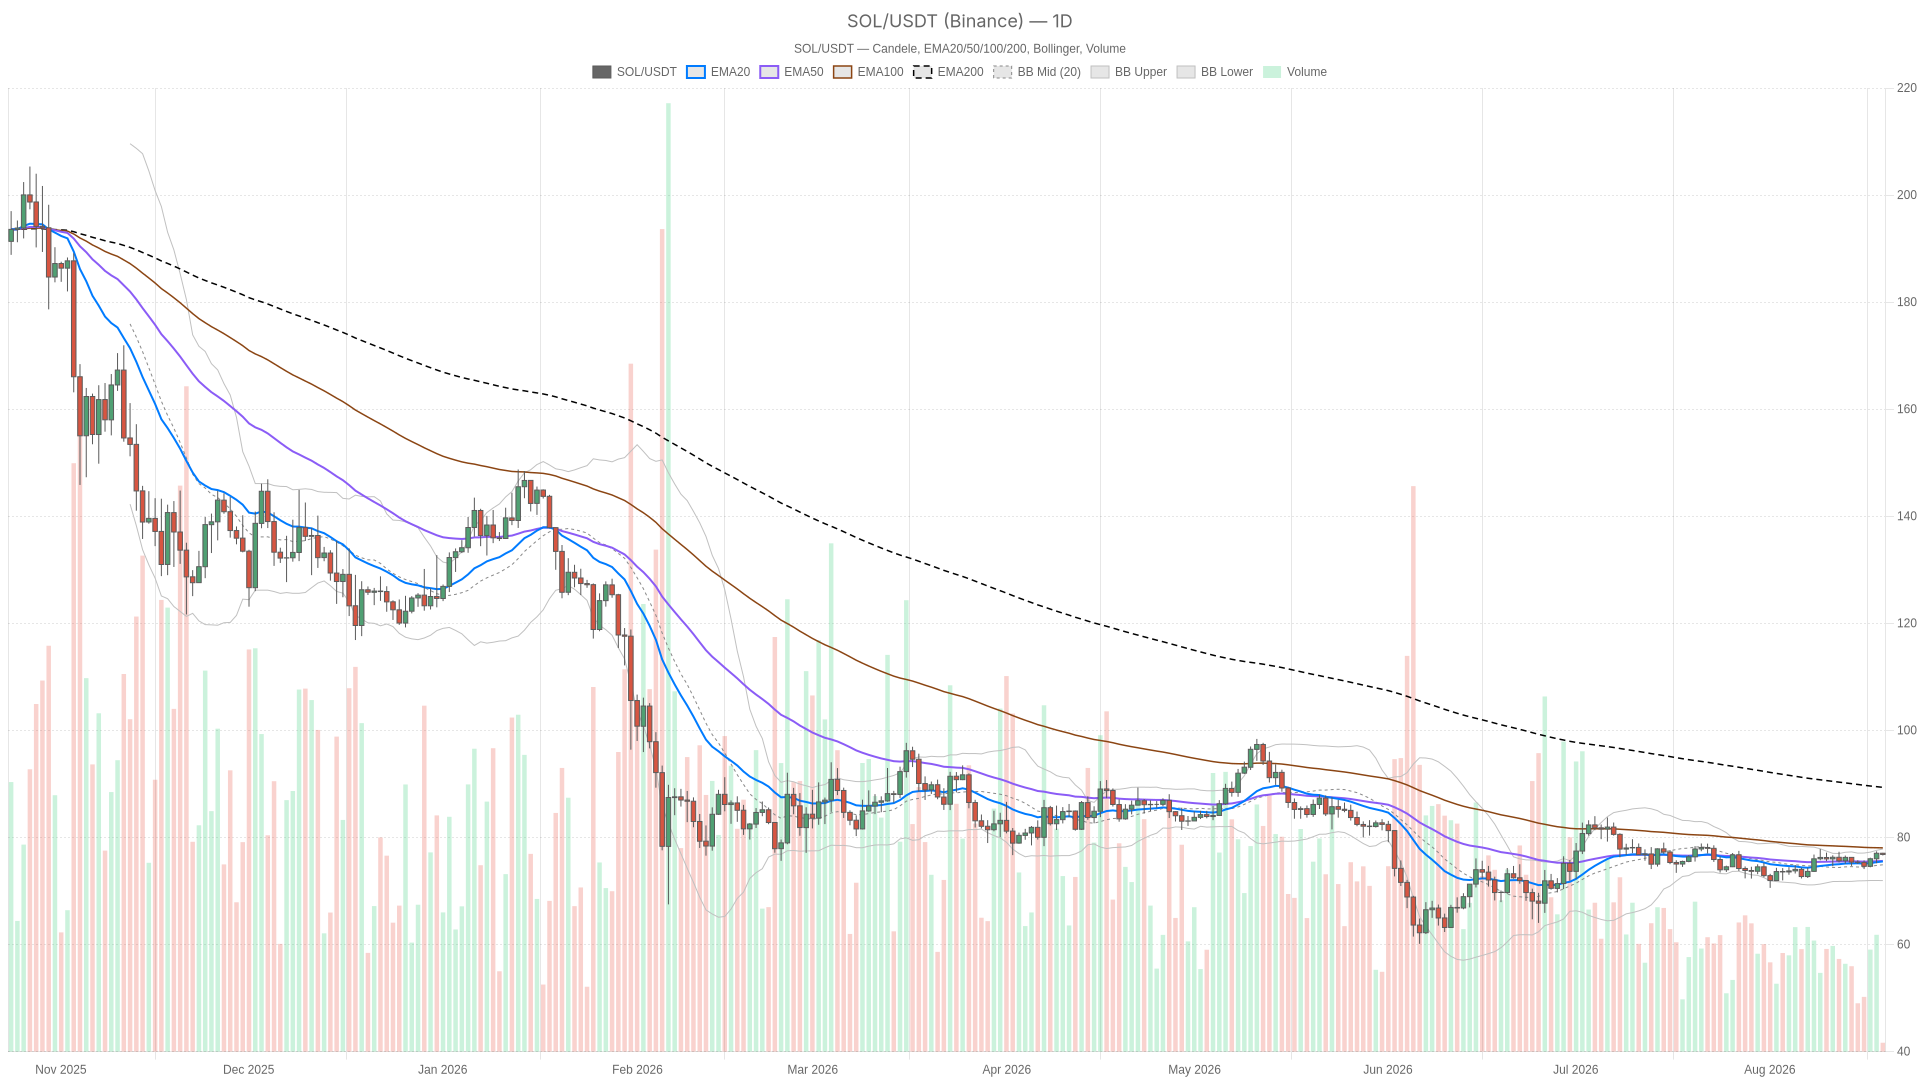
The daily regime is technically labeled neutral, and the price action backs that up on the surface. SOL closed at $76.83, just above both the EMA20 at $75.52 and EMA50 at $75.62, which have converged into a tight cluster acting as immediate support. RSI14 at 56.22 is mildly constructive, sitting above the midline without nearing overbought territory, leaving room to run if buyers step in with conviction. The MACD line at 0.33 versus a signal of 0.08 produces a positive histogram of 0.25, a decent sign that momentum has been building rather than fading over recent sessions.
However, none of that changes the more uncomfortable fact sitting on the chart: the EMA200 is up at $89.36, more than twelve dollars above current price. That gap means the dominant daily trend structure is still bearish underneath the recent bounce. What we are watching is a recovery attempt inside a larger downtrend, not a fresh uptrend. The Bollinger Bands reinforce this squeeze between optimism and caution: with the mid-band at $74.89, upper at $77.84 and lower at $71.95, price is pressing toward the top of its recent range. Daily ATR14 of $1.77 confirms there is still real volatility in play, enough for a decisive move in either direction over the next few sessions.
The 1-Hour Chart: Bullish Label, Momentum Losing a Step
Zooming into the 1-hour timeframe, the regime flips to bullish, and the EMA stack agrees. EMA20 at $76.68, EMA50 at $76.24, and EMA200 at $75.70 are all stacked in the right order for an uptrend. RSI14 at 56.13 mirrors the daily reading almost exactly, which signals alignment between the two timeframes rather than divergence. The MACD here, however, is where the story gets more cautious: the line at 0.27 has slipped below the signal at 0.31, producing a slightly negative histogram of -0.03. That is a subtle but real signal that upward momentum is stalling near resistance.
Meanwhile, the Bollinger Bands on the 1H chart show price hugging the middle-to-upper portion of the range, consistent with a market that wants to go higher but has not yet found the fuel for a clean breakout. The H1 pivot cluster is extremely tight — PP $76.80, R1 $76.87, S1 $76.75 — which tells you traders are boxed into a narrow decision zone right now.
15-Minute View: Compression Right at the Pivot
On the 15-minute chart, the regime reverts to neutral, and RSI14 has dropped to 45.19, below the midline. This hints at short-term seller pressure even as the higher timeframes stay constructive. The MACD line at -0.04 against a flat signal of 0.00 gives a small negative histogram of -0.03, reinforcing that immediate momentum has cooled off. Price is wedged between the EMA20 at $76.94 and EMA50 at $76.85, with the Bollinger Bands unusually tight — upper at $77.18, lower at $76.75. That is a classic volatility compression pattern. ATR14 here is just $0.18, the lowest reading across all three timeframes, which usually means the market is coiling ahead of a more decisive move.
Two Scenarios Worth Watching
The bullish case builds if price can clear and hold above the daily pivot at $76.86, follow through past R1 at $77.09, and eventually test the upper daily Bollinger Band near $77.84. For that scenario to have real legs, the H1 MACD would need to flip back above its signal line, confirming that short-term momentum is genuinely resuming rather than just drifting. A daily close that reclaims ground toward the EMA200 at $89.36 over time would be the real signal that this is more than a bounce.
The bearish case, on the other hand, is arguably the more structurally supported one right now, given how far price still sits below that daily EMA200. If SOL fails to hold the pivot and slips through S1 at $76.61, a retest of the EMA20 and EMA50 cluster around $75.52 to $75.62 becomes the next logical stop. A break below that zone would put the lower daily Bollinger Band near $71.95 back in play. Invalidation of this bearish read would require a sustained close above $77 with the daily histogram continuing to expand rather than flatten.
Sentiment and On-Chain Context
The Fear & Greed Index reads 46, classified as Fear. That is not panic, but it is also not the kind of risk appetite that typically fuels aggressive breakouts. Bitcoin dominance sits at 56.55% of a total crypto market cap around $2.28 trillion, which was up a modest 0.43% over 24 hours according to CoinGecko figures. That dominance level matters for Solana crypto specifically: when capital concentrates in BTC, altcoins tend to need a genuine catalyst to break out of consolidation rather than drifting higher on broad market flows alone.
One underappreciated data point sits on the DeFi side. Solana-based decentralized exchanges have shown sharp fee growth recently. PumpSwap fees jumped 87.35% in a single day, HumidiFi posted a 30-day fee increase of 886.59%, and BisonFi grew 150.33% over the same window, per DefiLlama-style fee tracking. Raydium AMM, meanwhile, saw 30-day fees up 82.79% even with a 7-day pullback of -20.14%. This kind of on-chain activity surge suggests real usage growth within the Solana ecosystem, which can act as a fundamental counterweight to the more cautious technical picture.
Positioning and Risk
Right now, Solana is caught between a daily chart still recovering from a much larger drawdown and shorter-term charts that are flashing tentative bullish signs without full conviction. The tight range across pivots, the Bollinger compression on the 15-minute chart, and the fading MACD histograms on both H1 and M15 all point to a market waiting for a trigger rather than one committed to a direction. Volatility, as measured by ATR across all three timeframes, remains present enough that a move could happen quickly once the pivot zone breaks decisively.
Given the mixed signals — daily momentum improving but still well below the long-term average, short-term structure bullish but losing steam — this is a market that rewards patience over conviction. Anyone watching this setup should weigh both the technical tension and the broader sentiment backdrop, keeping in mind that Fear-territory readings and BTC-dominant capital flows can cap upside moves just as easily as fundamentals like rising DEX activity can support a base. Nothing here should be read as a directive: it is a map of where the pressure points sit, not a guarantee of where price goes next.
FAQ
What is the key support level for Solana right now?
The EMA20 and EMA50 cluster around $75.52 to $75.62 serves as immediate support. If that zone breaks, the lower daily Bollinger Band near $71.95 becomes the next major floor to watch.
Is Solana’s trend bullish or bearish on the daily timeframe?
The daily regime is technically neutral, but price remains well below the EMA200 at $89.36. This means the dominant trend structure is still bearish despite improving short-term momentum indicators.
What on-chain signals support Solana’s fundamentals?
Solana-based decentralized exchanges have shown sharp fee growth, with PumpSwap jumping 87.35% in a single day and HumidiFi posting a 30-day increase of 886.59%. Raydium AMM also recorded 30-day fee growth of 82.79%, suggesting genuine ecosystem usage expansion.
Disclaimer: This article is for informational purposes only and does not constitute financial advice, an investment recommendation, or a solicitation to buy or sell any financial instrument or cryptocurrency. The analysis provided is not indicative of future results. Investing in crypto assets and financial markets carries a high risk of capital loss. Always do your own research (DYOR) and consult a qualified financial advisor before making any decision.
Article produced with the assistance of artificial intelligence and reviewed by the editorial team.
