




ADA is hovering near $0.25, and Cardano price today reflects compression rather than expansion, with the market pausing inside a broader daily bearish regime instead of following a clear upside reversal.
Summary
Main scenario: Neutral-to-bearish, with the daily chart still in control
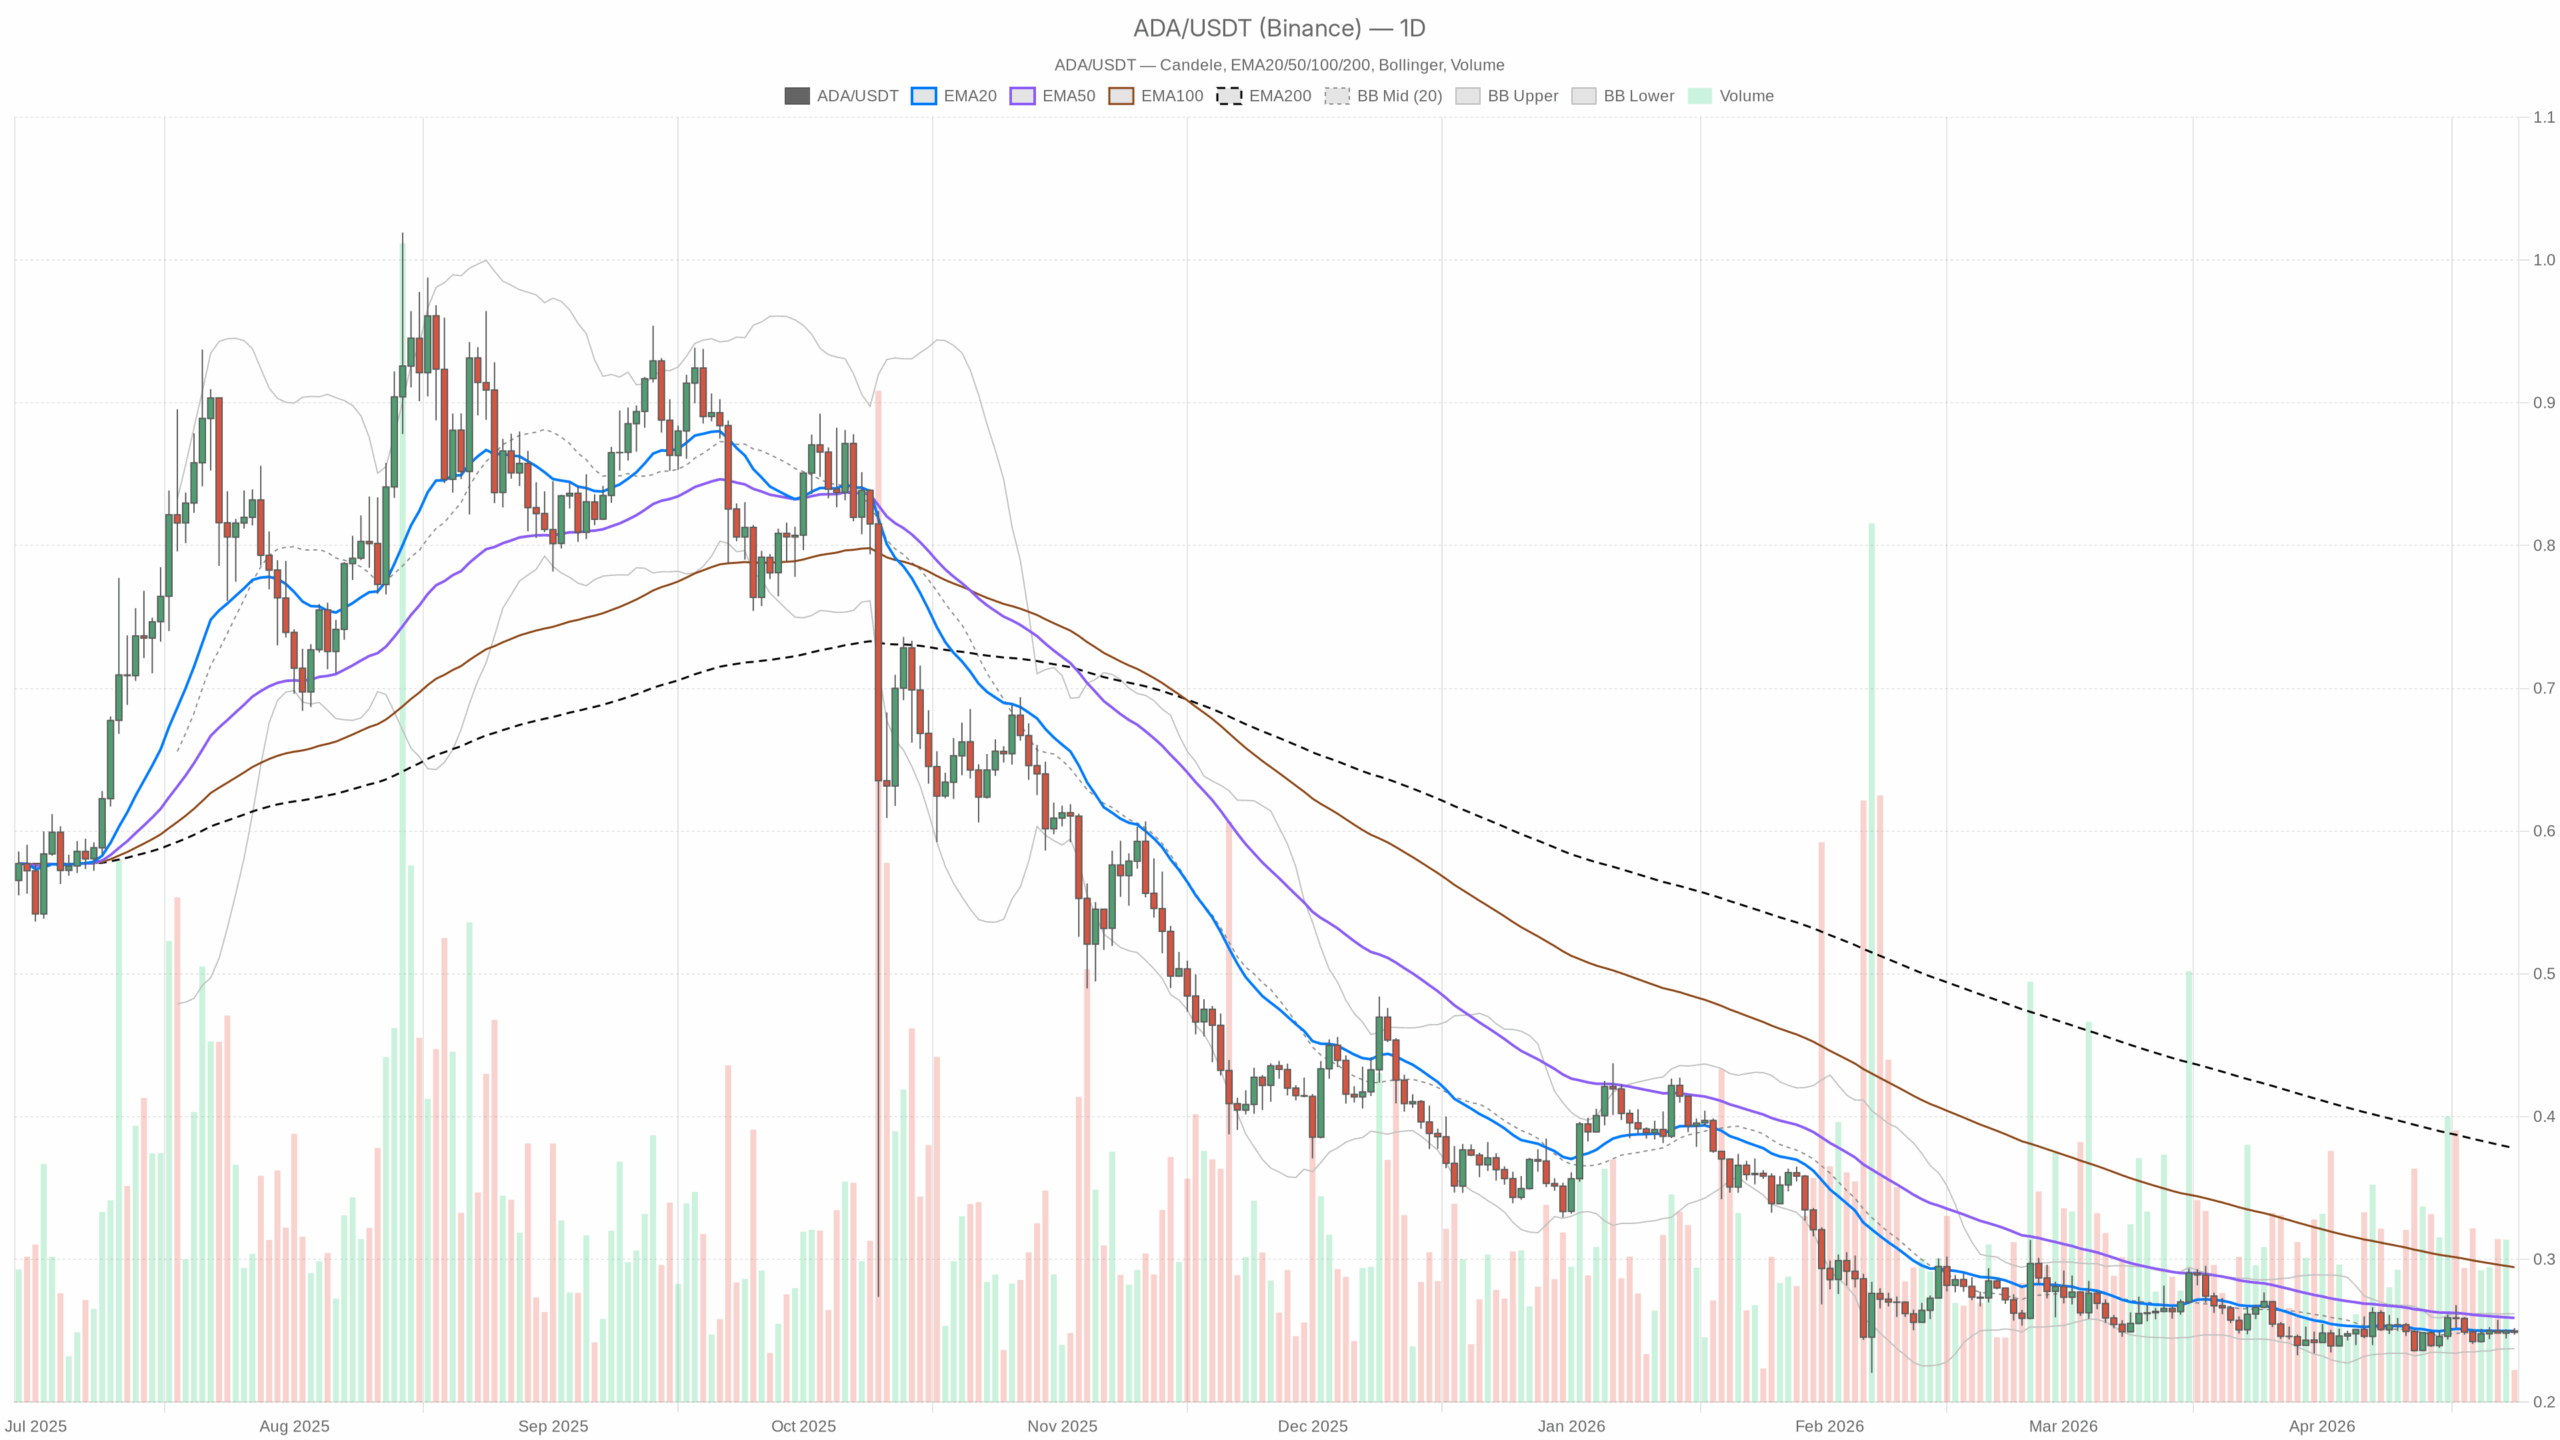
The daily timeframe defines the macro bias, and that bias is still bearish. Price is at $0.25, around the 20-day EMA at $0.25, but still below the 50-day EMA at $0.26 and far below the 200-day EMA at $0.38. That remains the key point. ADA is not in free fall, but it is also nowhere near reclaiming a healthier long-term structure.
Moreover, the lower timeframes are not offering much help. On the 1-hour and 15-minute charts, everything is flattened around $0.25. That confirms indecision rather than a fresh directional push. So the current setup is best described as range-bound in the short term, bearish in the broader structure.
If timeframes disagree, traders can often lean on intraday momentum. Here, however, they do not disagree in any meaningful way. They are simply dull while the daily chart keeps the bigger bearish ceiling in place.
EMA structure: stabilization is visible, but trend repair is not
On the daily chart, ADA trades at $0.25 with the 20-day EMA at $0.25, 50-day EMA at $0.26, and 200-day EMA at $0.38. Price being glued to the 20-day EMA tells you selling pressure has eased. However, the failure to reclaim the 50-day EMA shows the market still lacks upside authority.
The distance to the 200-day EMA is even more revealing. The long-term trend remains clearly damaged. On the 1-hour chart, the 20, 50, and 200 EMAs all sit at $0.25. The same happens on the 15-minute chart. That kind of alignment does not signal strength by itself; it signals a market with almost no directional impulse.
What this implies: ADA is stabilizing, but stabilization alone is not a bullish reversal. Bulls need a decisive reclaim of the daily 50-day EMA to argue that the market is shifting from defense to recovery. Until then, the trend still favors sellers on higher-timeframe rallies.
RSI and MACD: momentum is flat, not constructive
The daily RSI is 48.58, while the 1-hour RSI is 49.16 and the 15-minute RSI is 48.3. All three readings sit just below the neutral 50 area. That matters because ADA is not stretched enough to force a mean-reversion bounce, but it is also not strong enough to show sustained buying pressure.
This is one of those situations where RSI is more useful for what it does not show. There is no panic. There is no momentum breakout. There is just a market parked in the middle, waiting.
Meanwhile, the MACD on the daily chart is flat, with the line, signal, and histogram all at 0. The same flat reading appears on the 1-hour and 15-minute timeframes. That is about as neutral as it gets.
In practical terms, this backs up what price is already showing. There is no active momentum trend here. When MACD goes dead flat across multiple timeframes, breakouts become more meaningful when they finally arrive, because the market is compressing energy.
What this implies: Momentum is balanced but slightly soft. Cardano price today still reflects a holding pattern, not a confirmed reversal or continuation. The next push matters more than the current reading.
Bollinger Bands and ATR: volatility compression is the real story
On the daily chart, Bollinger Bands show a mid-band at $0.25, an upper band at $0.26, and a lower band at $0.24. Price is right in the middle of that range. On the 1-hour and 15-minute charts, the bands are effectively collapsed around $0.25, reinforcing the idea that short-term volatility has dried up almost completely.
That usually matters more than whether price is slightly above or below the mid-band. Tight bands mean the market is storing pressure. Therefore, the longer ADA stays pinned in this narrow pocket, the more relevant the eventual expansion becomes.
Given the daily bearish backdrop, traders should respect the possibility that a volatility breakout initially follows the dominant trend unless buyers can force a convincing reclaim of resistance. The daily ATR is $0.01, while the 1-hour and 15-minute ATR readings are effectively 0 in the supplied data.
Even allowing for rounding, the message is straightforward: ADA is not moving much right now. Low ATR is not bearish by itself, but it does change the trading environment. In dead conditions, breakouts fail more often when they are not backed by volume and structure.
What this implies: A squeeze is in place, but this is not a market rewarding impatience. Quiet conditions can break sharply, and in a weak higher-timeframe structure, downside resolution remains the more credible default unless bulls prove otherwise.
Pivot levels: the market is balanced at a fragile equilibrium
The daily pivot data shows PP at $0.25, R1 at $0.25, and S1 at $0.25. The same flat structure appears on the intraday timeframes. That unusual clustering reflects how compressed current pricing has become.
From a market logic standpoint, this means ADA is trading at a point where support and resistance are barely separated. In normal conditions, pivots help define directional bias. Here, however, they mainly confirm equilibrium. The next break away from this zone matters more than the pivot itself.
What this implies: ADA is sitting on a knife-edge. The market is balanced now, but balance at this level tends to be temporary. Once price escapes this cluster, direction should become clearer.
Bullish scenario: ADA needs to reclaim resistance, not just stop falling
The constructive case starts with ADA holding above the $0.25 area and then pushing through the daily 50-day EMA near $0.26. If buyers can do that and keep price above it, the current compression starts to look less like weakness and more like a base.
In that case, the daily chart would begin shifting from neutral-bearish to recovery mode, and the lower timeframes would likely turn supportive quickly because they are already tightly coiled. The bullish view would also be strengthened by a daily RSI move back above 50 and a MACD turn higher from its flatline condition.
What invalidates the bullish case: if ADA cannot reclaim $0.26 and instead slips back below $0.25 toward the $0.24 lower Bollinger area, then the idea of a developing base weakens quickly. In that scenario, the market is still just stalling under resistance.
Bearish scenario: compression resolves lower and the daily downtrend reasserts itself
The bearish case is simpler because it already has the higher timeframe on its side. ADA remains below the 50-day EMA and well below the 200-day EMA, while daily regime conditions are still marked bearish. If price loses the $0.25 balance zone and starts accepting below $0.24, the market likely treats this recent pause as distribution rather than stabilization.
That downside scenario becomes more credible if the daily RSI rolls back under the high-40s and the lower timeframes fail to produce any expansion above resistance. Moreover, in a fearful broader market, with crypto market cap slightly softer and Bitcoin dominance still elevated above 58%, altcoins like ADA do not have much room for error.
What invalidates the bearish case: a clean daily close above $0.26, followed by acceptance above that level, would weaken the immediate downside setup. If that happens, bears lose their short-term control over structure and would need a fresh rejection to regain the edge.
Positioning and risk: low volatility does not mean low risk
ADA is not doing much right now, and that can tempt traders into forcing a view. That is usually where mistakes happen. The daily chart still says the broader structure is fragile, while the intraday charts say momentum is asleep.
When you get that combination, the best read is not aggressive conviction but conditional positioning. As of 2025, the setup remains simple: bulls need proof through a reclaim of $0.26, while bears need proof through a breakdown below $0.25 and especially $0.24.
For now, ADA remains trapped between stabilization and continuation risk. Until one side gets confirmation, it stays a compressed market where volatility is low on the surface but capable of expanding quickly once equilibrium breaks.
