



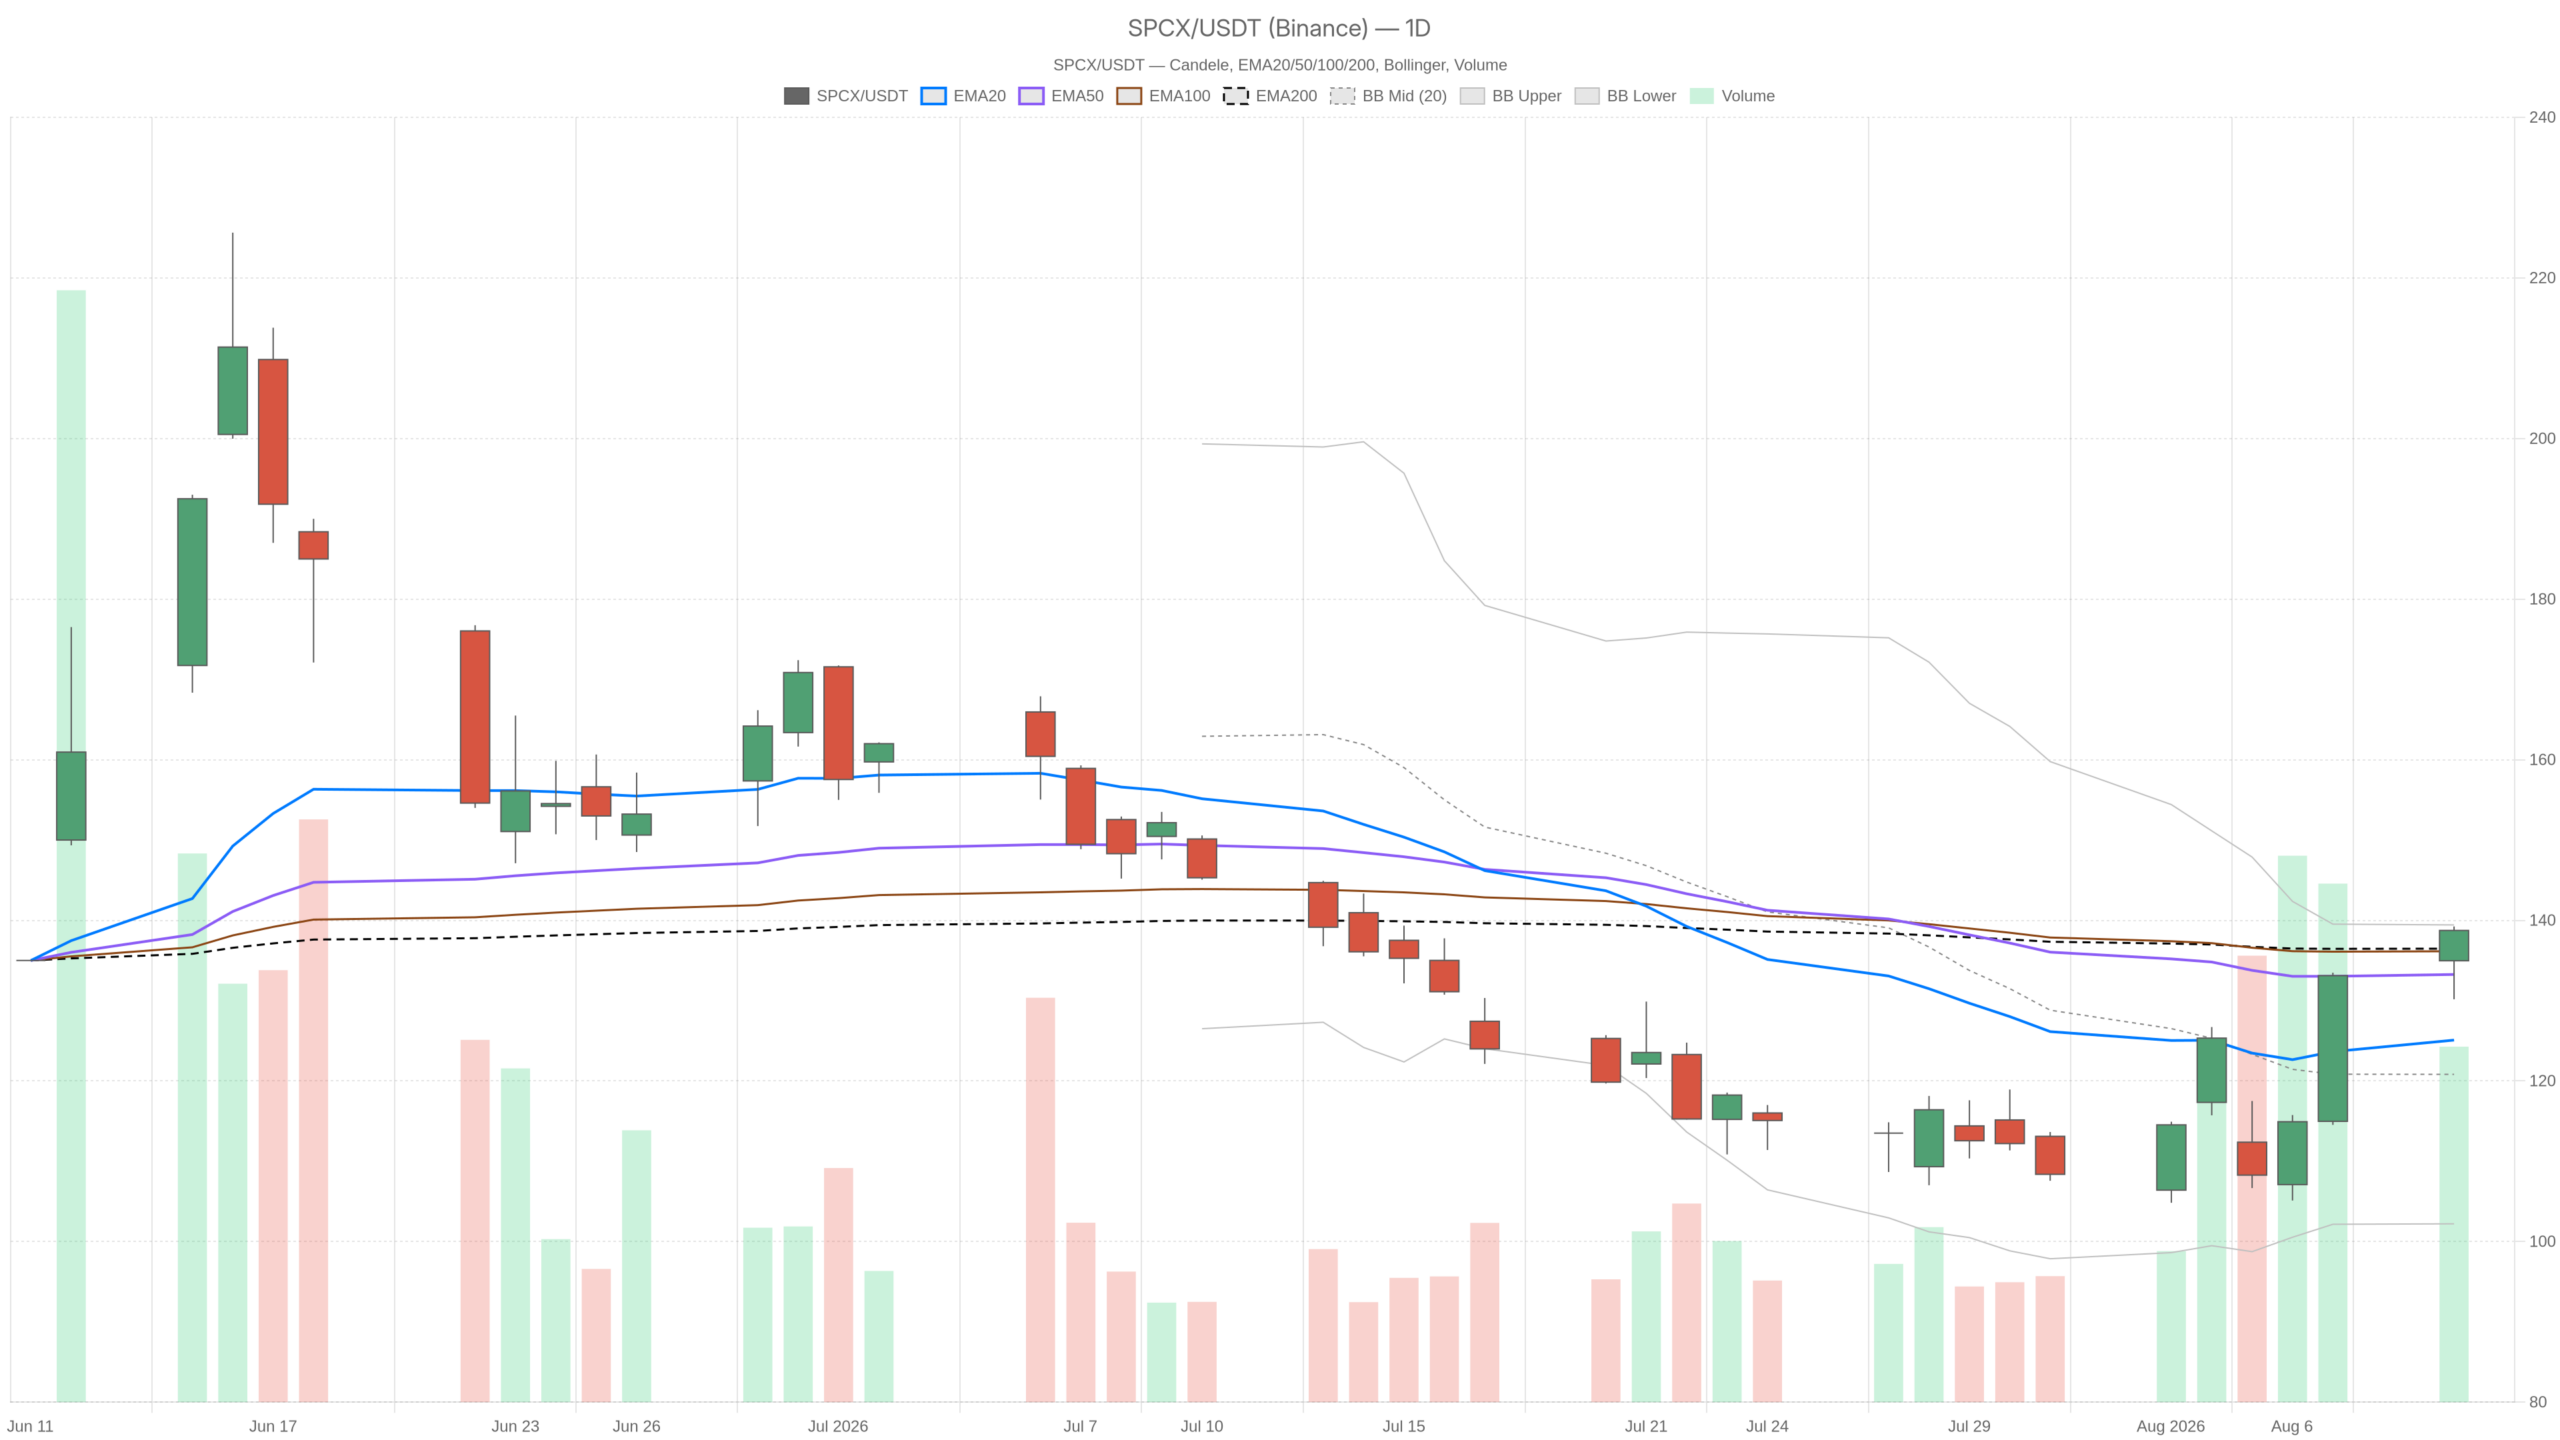
SpaceX Stock (SPCX) has staged one of its sharpest recoveries since June. It closed at $138.74, reclaiming the $135 IPO benchmark for the first time since July 16. The bounce is real — but the daily trend has not yet decisively flipped.
Summary
Key takeaways
- SPCX closed at $138.74, reclaiming its $135 IPO line for the first time since July 16.
- Price is now testing the daily 200-period EMA at $136.47 and the upper Bollinger Band at $139.43 simultaneously.
- Daily RSI at 57.22 shows recovering momentum; hourly RSI at 73.79 and 15-minute RSI at 75.99 flash exhaustion warnings.
- A daily ATR of 10.15 signals extreme volatility — position sizing matters more than precision entries.
- Bullish confirmation requires a close above $139.43; bearish invalidation begins with a loss of daily S1 at $132.86.
Daily structure: neutral bias with an improving tilt
The daily regime reads neutral because price sits above all three key moving averages — yet the averages remain bearishly ordered. This is a strong counter-trend recovery that has just reached its first serious wall of resistance. Price is now pressed against the daily 200-period EMA at $136.47 and the upper Bollinger Band at $139.43 simultaneously. Rebounds of this speed rarely resolve quietly. Either buyers convert this zone into a base, or the rally hands back a meaningful slice of its gains.
Moving averages still point to repair, not reversal
The 20-period EMA sits at $125.08, the 50-period at $133.26, and the 200-period at $136.47. Price trades above all three, which is constructive. However, the averages are still ordered in a bearish sequence, with the fast EMA below the slower ones. That is the signature of a downtrend being repaired, not a downtrend already reversed.
Momentum improves but stays in negative territory
Daily RSI has recovered to 57.22, comfortably out of weakness but not yet stretched. Meanwhile, the MACD line at -4.77 remains below zero. It has crossed above its signal at -7.84, leaving a positive histogram of 3.07. Selling pressure has faded faster than it built. Still, the absolute MACD level is negative, so the burden of proof stays with buyers.
Volatility remains the dominant variable
For SPCX, the daily ATR of 10.15 is enormous relative to a $138 share price. Bollinger Bands span $102.21 to $139.43 with a midpoint at $120.82. That unusually wide range reflects the violence of the recent swings. News flow supports the picture: shares jumped 15.83% on Friday, August 7, extending a rebound off a record low. At the same time, separate coverage flagged the stock as still down 34% from its post-IPO peak. Therefore, position sizing matters more than precision entries.
For SPCX, daily pivots frame the near-term battlefield. The pivot point sits at $136.05, with resistance at $141.93 and support at $132.86. Price closed above the pivot, keeping the short-term advantage with buyers. A sustained loss of $132.86 would be the first mechanical crack in the recovery.
The 1H chart confirms the trend but flashes exhaustion
The hourly chart shows the strongest trend confirmation of all three timeframes. Price closed at $138.68, far above the 1H 20-EMA at $127.81, the 50-EMA at $121.82, and the 200-EMA at $129.61. The hourly MACD is outright positive, with the line at 5.40 above its signal at 4.53 and a histogram of 0.88. Trend and momentum agree on this horizon.
However, hourly RSI at 73.79 is a warning about pace, not direction. Readings that high usually mean the move has run ahead of its own support structure. The 1H Bollinger midpoint sits all the way down at $125.47 — more than thirteen dollars below spot. That gap is the mean-reversion risk in a single number.
Meanwhile, hourly pivots are tight, with a pivot at $137.73, resistance at $140.19 and support at $136.21. The 1H ATR of 4.12 says intraday swings of four dollars are normal. Those two facts together mean the pivot band can be swept in either direction without changing the larger picture.
15m execution context: a band walk, not a base
The 15-minute chart is explicitly bullish. Price is walking the upper Bollinger Band — typical of trend continuation but also of the final phase of a thrust. The EMA stack is clean: 133.59, 129.79 and 120.42 from fast to slow. Price at $138.68 is trading above the upper band at $136.87, with the midpoint at $133.23.
At the same time, 15-minute RSI at 75.99 is the most stretched reading across all three timeframes. The MACD remains positive at 1.63 versus a 1.31 signal, so there is no loss of drive yet. The 15-minute ATR is just 1.36 with pivots at $138.38, $139.54 and $137.52. Intraday structure is compressed right beneath the daily upper band. Short-term traders are effectively working inside a one-dollar box under major resistance.
The bullish scenario for SpaceX Stock
The bullish case requires one thing above all: acceptance above $139.43 and the $136.47 daily 200-EMA on a closing basis. That would turn the IPO price area from resistance into a platform. The next reference point is the daily R1 at $141.93. Beyond that, the hourly upper band at $144.88 becomes the extension target.
Fundamentally, the narrative backdrop is supportive. Coverage cites strong earnings, analysts raising forecasts, and a bounce from triple-bottom support. Combined with a daily MACD histogram that has turned positive, that gives the rally a credible reason to persist. Notably, a shallow pullback that holds above the daily pivot at $136.05 would be the healthiest possible continuation pattern.
The bearish scenario and what breaks the bull case
The bearish path starts with rejection at exactly the level price is testing now. A failure to close above $139.43, followed by a slide under $136.05, would suggest a mechanical bounce rather than a trend change. Loss of daily S1 at $132.86 would then open the gap toward the daily 20-EMA at $125.08. Further down lies the daily band midpoint at $120.82.
In contrast to the hourly strength, the daily MACD is still negative and the EMAs remain bearishly ordered. That is the structural argument for caution. Add overbought RSI on both the 1H and 15m charts, and the risk of a fast unwind is obvious. With a daily ATR above ten dollars, a single session can erase several days of grinding progress.
Positioning into an unresolved test
The signals are genuinely mixed across timeframes, arguing for patience around $136–$139 rather than conviction in either direction. The 15-minute chart is bullish, the 1H is strongly trending but overextended, and the daily is neutral with improving momentum. The zone between the daily pivot at $136.05 and the upper band at $139.43 is the entire argument in a five-dollar range.
Still, volatility remains the dominant variable for SpaceX Stock. The ATR readings across all three timeframes confirm it. Until the daily chart produces a decisive close above the 200-EMA and the upper band, the recovery should be treated as unconfirmed. The direction of the next impulse will likely be settled at the $135 IPO line. That line is now the market’s reference point rather than a footnote.
FAQ
What is the key resistance level for SpaceX Stock right now?
The critical resistance zone sits between the daily 200-period EMA at $136.47 and the upper Bollinger Band at $139.43. A decisive close above this zone would turn the $135 IPO area from resistance into a platform for further gains.
Is the SpaceX Stock (SPCX) rally sustainable?
The rally has credible fundamental support — strong earnings, analyst upgrades, and a triple-bottom bounce. However, overbought hourly and 15-minute RSI readings, combined with a still-negative daily MACD, mean the move remains unconfirmed until the daily chart produces a closing break above $139.43.
What would confirm a bullish trend reversal for SPCX?
A confirmed close above the daily upper Bollinger Band at $139.43 and the 200-period EMA at $136.47 would be the first structural signal. A shallow pullback that holds above the daily pivot at $136.05 would further strengthen the bullish case.
How volatile is SpaceX Stock currently?
Extremely volatile. The daily ATR of 10.15 means routine daily swings of over ten dollars on a roughly $138 stock. The hourly ATR of 4.12 confirms that even intraday moves of four dollars are normal, making position sizing critical for any trading approach.
Disclaimer: This article is for informational purposes only and does not constitute financial advice, an investment recommendation, or a solicitation to buy or sell any financial instrument or cryptocurrency. The analysis provided is not indicative of future results. Investing in crypto assets and financial markets carries a high risk of capital loss. Always do your own research (DYOR) and consult a qualified financial advisor before making any decision.
Article produced with the assistance of artificial intelligence and reviewed by the editorial team.
