

Ethereum price

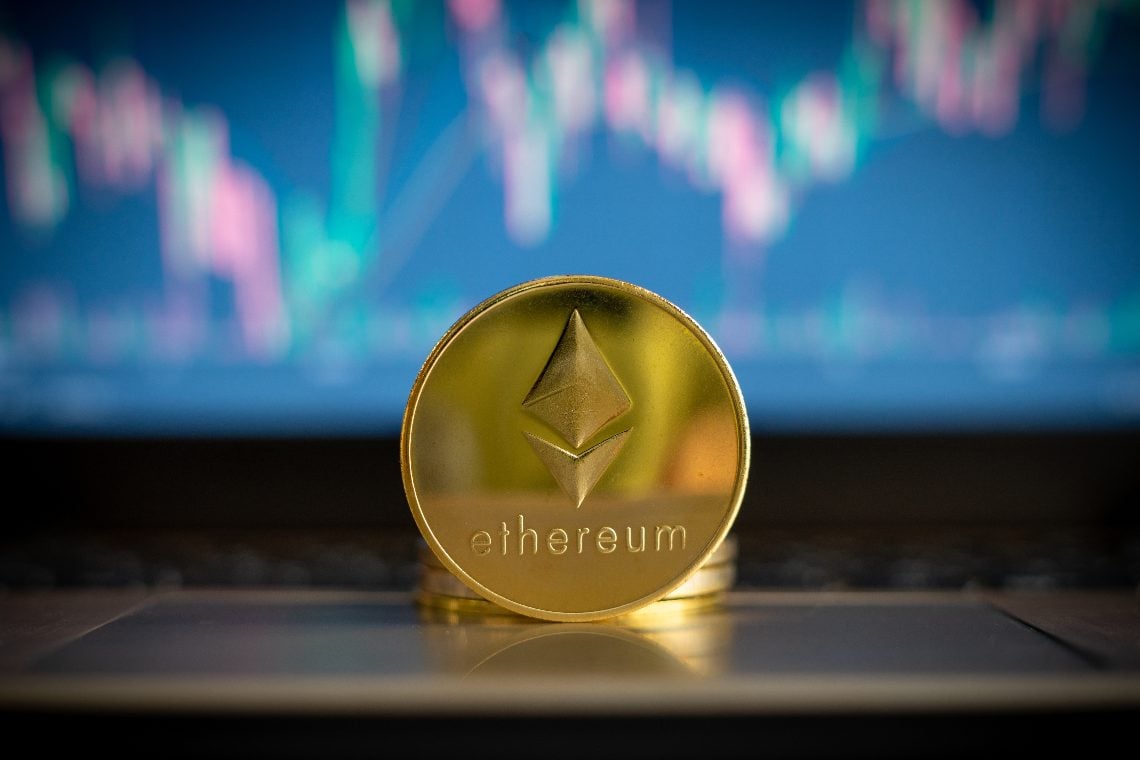
The price of Ethereum is -16.9% at the time of writing and has begun to really capitulate to the macro over the past 7 days.
Ether is -24.2% over the last week so is there any hope of short term relief forthcoming?
The below chart by TradingView’s Solldy illustrates their belief that ETH is due for a nice break upward in the short-term.
You can also see that Ethereum is testing long term support dating back to early April with a lot of touches on the trendline.
ETH is also testing the 200 Day MA for the first time since April 23, 2020 following the black swan covid-crash. This isn’t the most bullish indicator for Ether bulls and there’s more bearish news yet.
Additionally, the RSI on Ether is also at the lowest levels it has seen since March 2020.
While Ethereum enthusiasts are hopeful that EIP 1559 goes live next month as anticipated and boosts the price, a lot will rely on bitcoin and the macro cryptocurrency environment.
Ether is +94% against BTC for the last 90 days but bitcoin dominance [44.4%] is on the rise. Ether is -6.5% against BTC for the last week and Ether’s dominance is 16.4%.
Ether’s 52 week range is $216-$4,352.
Ethereum really needs bitcoin to level off or reverse soon to the upside to stay above $1,760.
Bitcoin’s showing its lowest levels on the RSI since March 2020 [the covid crash] as well and could drag the rest of the market down with it.
If $1,700 is breached to the downside there’s not a lot of historical resistance looking left on the ETH chart until the former ATH of $1,448.
ETH had a Monday daily candle close of $1,892.
The price of AAVE

AAVE is -66% since it made its all-time high on May 18 of $661.69.
AAVE token is -24.4% at the time of writing and AAVE is further proof of how homogenous the crypto market is yet. This very nascent industry is still largely at the whim of bitcoin’s price action and many alts sold-off on Monday following bitcoin’s lead yet again – AAVE was not excluded.
As you can see in the above chart, AAVE is also thought to be in the midst of Wyckoff Accumulation. Jos1101’s chart on TradingView implies that AAVE could be in the process of moving from Phase D to Phase E of the pattern.
With BTC’s pattern looking remarkably similar there could be further downside still for the crypto market before the spring phase of Wyckoff Accumulation and some price relief.
If AAVE can put together some bullish momentum and get back to $400 there’s a case for bulls to break out there and feel better about the short-term outlook.
AAVE’S 52 week range is $.11-$655.
Monday’s daily candle closed at $213.20.

