Bitcoin analysis
Bitcoin’s posted green candles on the daily 5 of the last 8 days. There appears to be some bullish momentum emerging after withstanding one of the greatest pullbacks in this asset class’s history.

BTC is back in green figures again on the monthly but just marginally +.75%. According to the relative strength index [RSI] BTC has an average reading of 14.
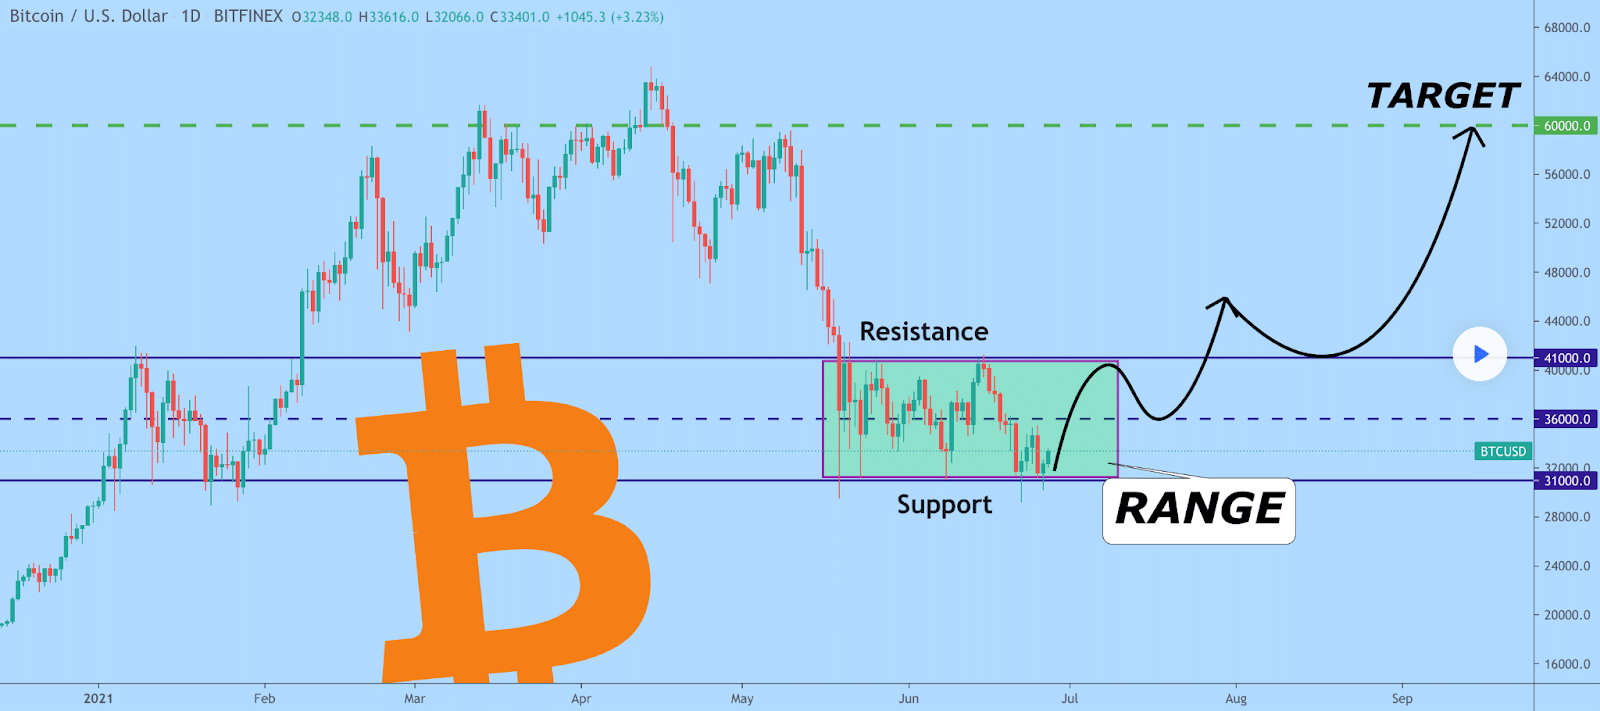
The chart below from AtlasTrades indicates their bullish interpretation of how things play out if BTC can break $35k to the upside.
A lot of charts show a similar characterization as the first one with an obvious double-bottom painted at the local support resistance and bitcoin working itself back to the middle of the range yet again. The below chart from MMBTtrader notes a similar overhead resistance zone around $41k that could be challenged if things do continue to trend to the upside and that’s a particularly important short-term region to watch closely.

Bitcoin’s Fear and Greed Index is +3 points from Sunday but still stuck in the Extreme Fear Zone at 25.

Of course bulls would love to get back above $40k before Grayscale unlocks more than 16,000 GBTC onto market. It would be nice from a bullish perspective to absorb any seller pressure above that price rather than below it. There seems to be much uncertainty regarding whether or not this event will cause much sell pressure on the market after the 6 month holding window ends in mid-July [that holders must comply with before selling].
Buyers will be hoping Tuesday’s daily close brings green figures again after Monday’s candle finished in red figures by less than $100 at $34,430.
BTC started Tuesday’s first 4hr candle testing $35k. Bulls and bears alike will wait for further short-term confirmation over the coming day about what’s in store to close June and Q2.
Loopring analysis
Loopring’s +27.07% for the last 7 days and one of the hottest assets in the crypto sector by the numbers.
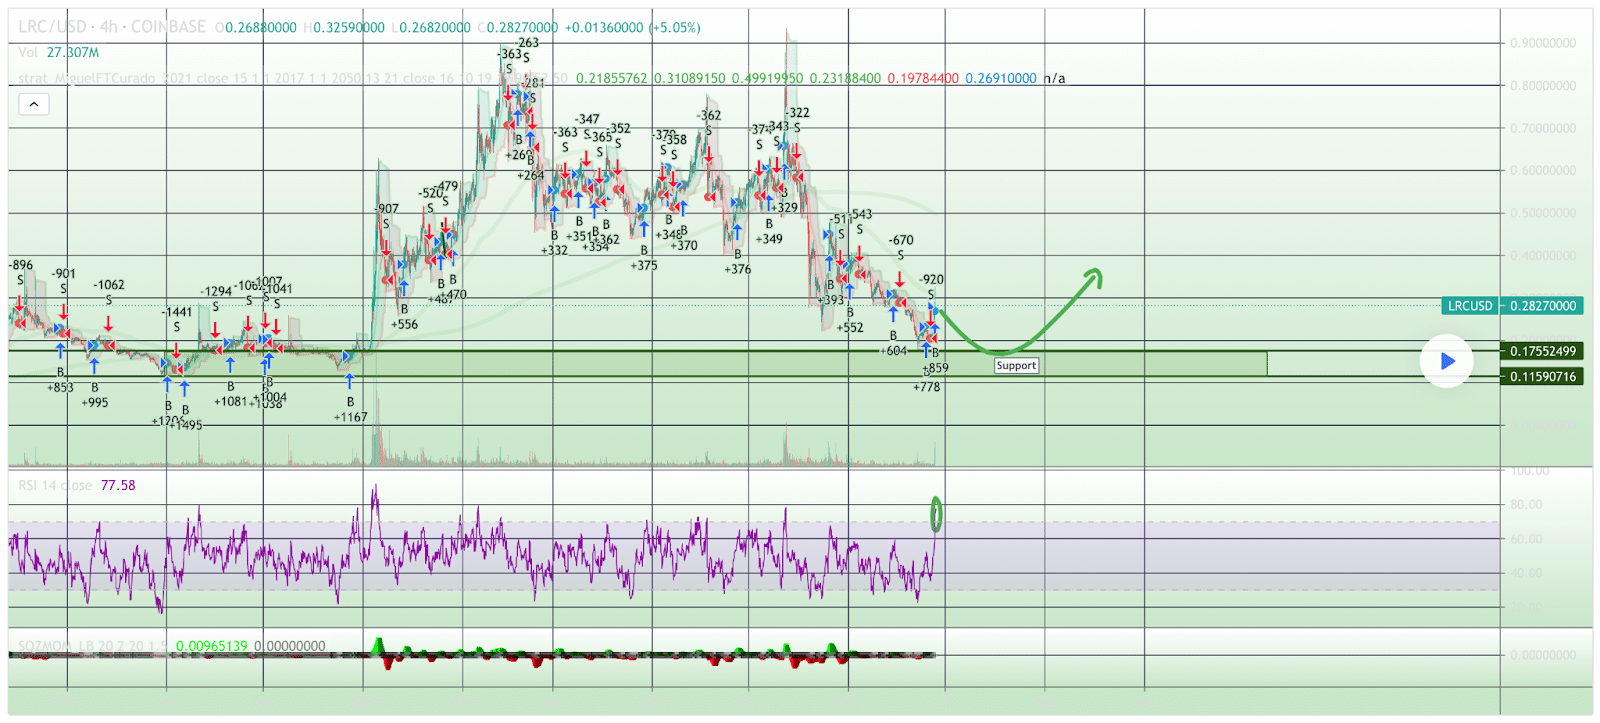
LRC appears it’s also carving out strong support at $.115. MiguelFTCurado’s chart below indicates if overhead resistance at $.29 is breached [and the macro cooperates] then the price could markup considerably to $.39.

With the macro again looking a bit more bullish we could begin to see alt coins like LRC start to get an increase in bids. With so much sell pressure across the entire cryptocurrency market lately sellers may be exhausted at least for the interim.
Loopring’s 24hr range is $.265-$.325 and 52 week range is $.071-$.845.

LRC’s candle closed in negative figures for the first time in 4 daily candle closes on Monday worth $0.279.
Loopring started Tuesday’s first 4hr candle in positive figures as price action flipped and buyers started the new day bidding.


