


Bitcoin analysis
Bitcoin is still clinging to $31,5k as strong support resistance and has been range bound for 61 days. That range between $29k-$42k has yet to be broken.
The majority of BTC price action over the last week was below $35k and the shortage of volatility is reminiscent of this time last year when bitcoin was $9,202. BTC is +245.8% since that figure despite a 51% drawdown over the last three months.
Although there’s been heavy speculation about an imminent sell-off from GBTC buyers as their shares unlock between July 17-19 there wasn’t anything to point to over the weekend that suggests bitcoin’s price was affected directly.
Although BTC’s price has been trending downward for over 90 days there’s still a lot of optimism and bullish sentiment from bitcoin bulls.
Billionaire tech entrepreneur and bitcoin bull, Michael Saylor, appears as bullish as ever and published this tweet on Sunday.
Don’t wait to buy #bitcoin, buy #bitcoin and wait.
— Michael Saylor⚡️ (@saylor) July 18, 2021
The below chart from VincePrince shows an ABC-Flat-Formation that has a first target around $36,5k which he notes as the ‘Remaining-Resistance Cluster’.
This sequence can only play out if bitcoin breaks a short-term trendline at $33k. Otherwise bulls will hope that $30k holds or it could be a quick trip to challenge the low price of this downtrend around $29k.

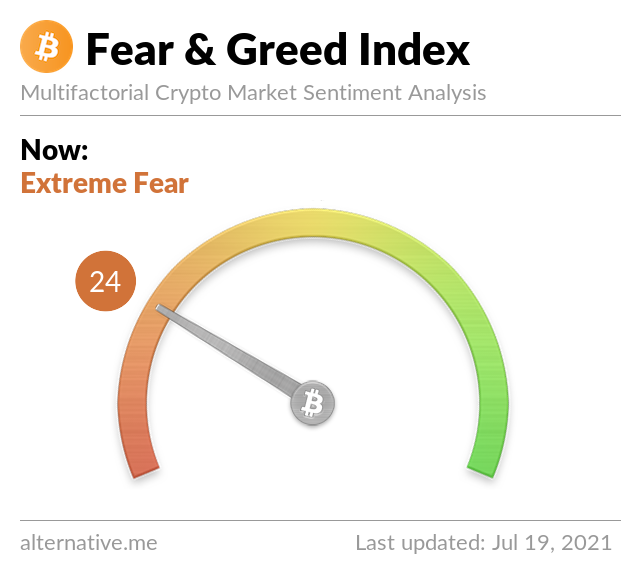
Bitcoin’s Fear and Greed Index is 24 and up 5 points from yesterday’s reading.
BTC’s 24 hour range is $31,111-$32,453 and the 7 day range is $31,111-$34,596. Bitcoin’s 30 day average price is $33,504.
Bitcoin closed Sunday’s daily / weekly candle worth $31,824 – it was the second consecutive daily close in green figures.
Ethereum analysis
Ethereum bulls are eager for EP-1559 to go live and are clinging to $1,900 as support resistance while anticipating its launch.
The below chart from neofx11 shows Ether is back above an important trendline on the 4hr chart dating back to early June.
The next stop overhead for ETH on the chart is $2,600 but $2,500 on other timescales has been a significant barrier over the last few weeks.

A failure to break to the upside and start pushing upward with some momentum could yield a trip back to the low of this downtrend at $1,781 to test that area again.
ETH’s 24 hour range is $1,879-$1,991 and 7 day range is $1,860-$2,174. Ether’s 30 day average price is $2,071.
Ether closed Sunday’s daily / weekly candle worth $1,891 and in red figures after closing in green figures on Saturday.

