Bitcoin analysis
Bitcoin finally capitulated to bears at $30k in the early hours of Tuesday morning’s daily candle. The battle throughout was a back and forth affair with bears ultimately winning out for the day.
Michael Saylor, arguably bitcoin’s largest holder after Satoshi Nakamoto the pseudonymous creator of BTC, has remained cheerful while bitcoin’s summer lull continues.
#Bitcoin fundamentals have never looked better.
— Michael Saylor⚡️ (@saylor) July 20, 2021
While the fundamentals on bitcoin have never looked better with adoption across the board occurring in 2021 – what about the technicals?
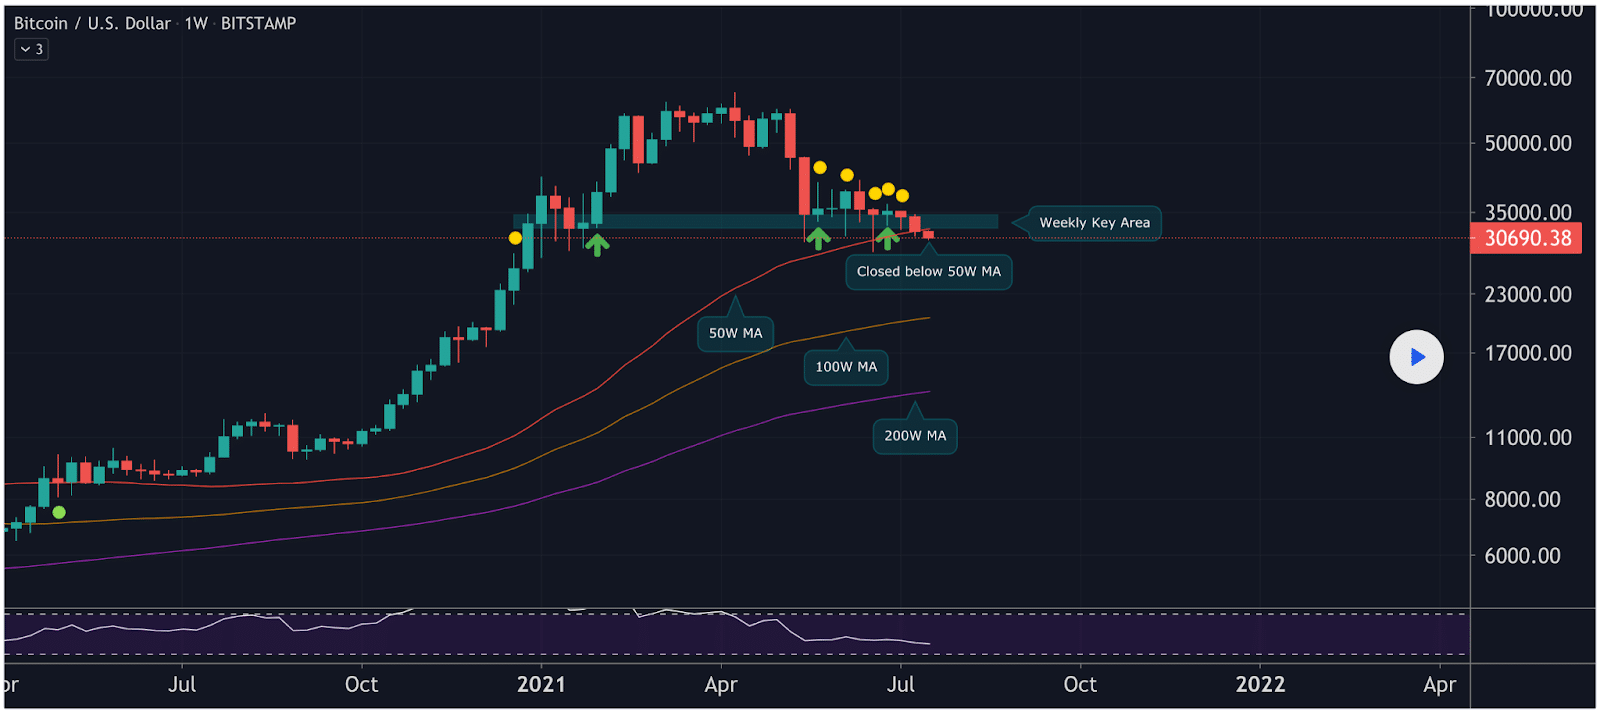
The below chart from PolarHusk denotes BTC’s drop and close below the 50W MA and his belief that it’s critical to get back above that moving average [$33k] over the next few days.
If bitcoin fails to break out of this region to the upside then there will be further tests of the $28k zone which is a strong demand area. If $28k fails and bears push the price lower there’s not a lot of support resistance historically between $28k and the former multi-year high from 2017 at $20k.

Bitcoin’s 24 hour range is $29,313-$30,715 and the 7 day range is $29,313-$33,098. BTC’s 30 day average price is $33,092.
BTC closed Tuesday’s daily candle worth $29,806 [-3.37%] and in red figures for the second consecutive day.
Ethereum Analysis
Ether bulls couldn’t hold the $1,900 price level any longer despite it proving as strong support resistance over the last few weeks. The next stop down is the low of this downtrend at $1,719.
Could EIP-1559 Coincide with the bottom of the bear market?
EIP-1559’s pull request has been submitted for mainnet activation on the Ethereum blockchain. The proposal should go live on August 4 but to be even more specific it will occur at block number 12,965,000 on the Ethereum mainnet.
EIP-1559’s proposal is expected to have a massive effect on Ether’s monetary policy moving forward after the London hardfork occurs. It essentially over time could turn Ether’s monetary model into a deflationary model via burns of Ether when transactions occur on the network.
With so much anticipation around this event and the event only two weeks away, where will Ether go next?
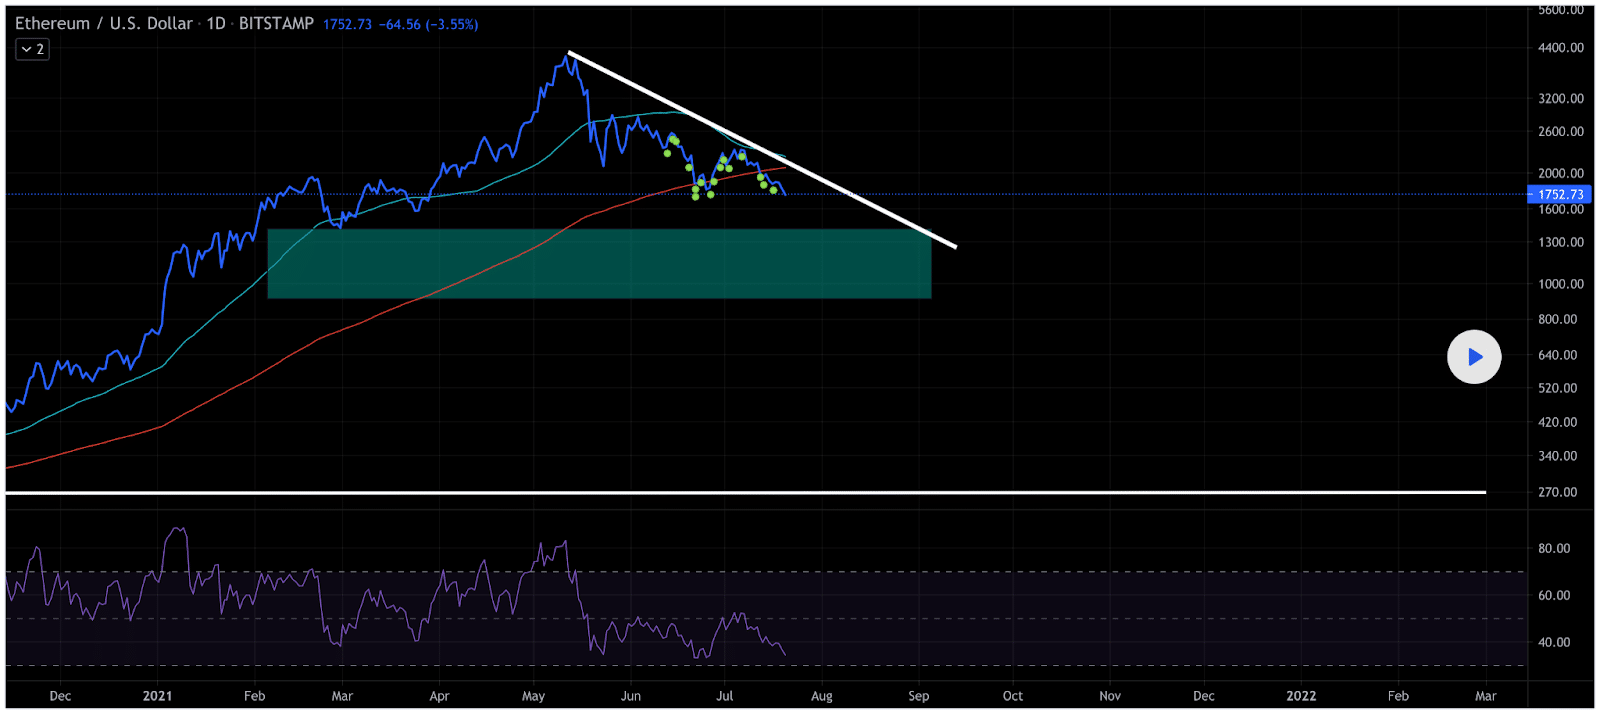
The below 1D chart from IWealthCommunity shows how critical of an area Ether’s price is in the short term.
Beneath $1,719 the best shot at support resistance is the former multi-year all-time high of $1,448. The top of the green zone on the chart below is Ether’s former peak price.

For Ether bulls to really gain some short term momentum they need to get back above the trendline [$1,915].
Ether closed Tuesday’s daily candle worth $1,785 for a third consecutive red candle close on that timescale.


