

Summary
Bitcoin Analysis
Bitcoin teetered at $45k on Wednesday while the majority of altcoins continued selling off for the bulk of the daily candle. BTC is -1.7% for the last 7 days, so where does the price action go to close the week since bears have hit a pause on the bullish uptrend?
The chart below from T_V_TreeTrader shows bitcoin’s price is still in the middle of an ascending channel with strong support at $43,3k.
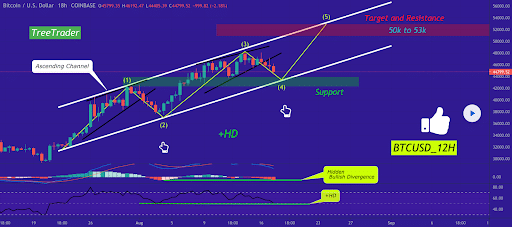
Bitcoin bulls need to hold $43,3k if bids don’t come in to send the price higher first. Above, you can see that BTC’s price is maintaining its current demand line dating back to July 22nd, and no technical damage has occurred yet to the chart at the time of writing.
If bears can crack $43k, the next support resistance for bullish traders is $40k. On the contrary, if bulls can get back to the top of the range, a trip to $50k may be imminent, and new levels will be established for traders above $50k.
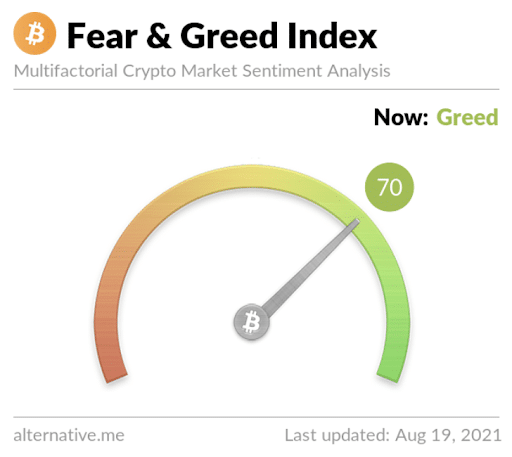
Bitcoin’s Fear and Greed Index is reading 70 and -3 from yesterday’s reading.
BTC’s 24-hour range is $44,631-$45,922 and the 7-day range is $43,965-$47,862. Bitcoin’s 30-day average price is $40,669.
BTC closed Wednesday’s daily candle worth $44,744 and in green digits for the first positive daily close in five days.
Quant Analysis
Quant’s one of the few alts that didn’t get crushed during Wednesday’s candle. In fact, QNT actually managed to climb more than $50 in value or 30% of its value at times and also made multiple new all-time highs.
So, with so much positive momentum over the past 24 hours, what are the charts telling us about Quant?
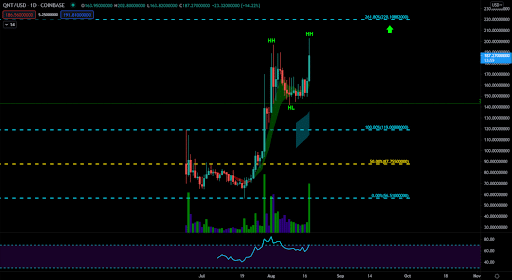
The below chart from @BlueCrypto_ on Twitter shows how strong QNT appears on the daily timescale with new higher highs and a new all-time high of $202.80.
Bulls need to try and hold $180, which is currently acting as a new support resistance. If that level fails, the next stop could be back down to $140.
This asset has only continued to run, cool, reset, and then run again over the last 90 days. If bears can’t push the price lower over the next couple of days, much higher prices on QNT could be forthcoming before the end of August.
QNT’s 24-hour price range is $169.07-$202.80, and the 7-day price range is $146.96-$202.80. Quant’s average price over the last 30 days is $134.29.
Over the last 30 days, QNT is +200% against the U.S. Dollar, +102% against BTC, and +77.79% against ETH.
Quant closed Wednesday’s daily candle worth $184.61 and in green figures for the second consecutive day.