Summary
Bitcoin analysis: the price is falling
Bitcoin [the macro] and most altcoins retraced on Tuesday after reaching major inflection points where traders settled up.
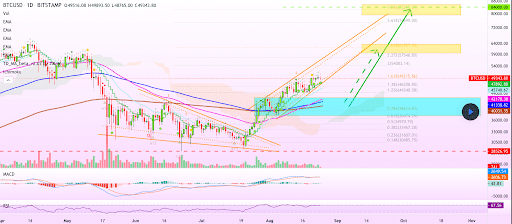
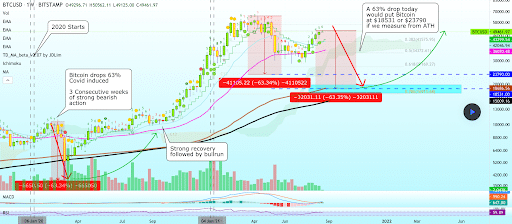
The first bitcoin chart below is from the same chartist as the second, but each paints entirely different scenarios for BTC moving forward.
The first chart denotes the likelihood that the $60k target that many bullish traders expect could be too low of a target, even short-term. The chartist below believes the probability is increasing that $84k is met where the top of the ascending channel on the 1D chart could peak.
The technical analysis that points towards much higher prices on the daily timescale could be negated with a close below $47,5, putting BTC beneath its current trendline.

Bearish traders will find solace in the 1W chart below from AlanSantana that posits that bitcoin could be amid a bearish correction. The chart points to a retrace to a figure as low as $18,5k for bitcoin if it matches historical pullbacks.

Despite the worst-case scenario above not jiving with bitcoin’s historical bull/bear cycle trend, a bearish scenario must be entertained as well – it’s important to remain impartial to the bullish momentum the market’s been experiencing for nearly two months.
Bitcoin Fear and Greed Index
BTC’s Fear and Greed Index is reading 73 and in the ‘Greed’ zone. Yesterday’s reading was 6 points higher at 79 and in the ‘Extreme Greed’ zone.
Bitcon’s 24 hour price range is $47,555-$49,860 and the 7 day price range is $44,213-$50,311. BTC’s 52 week range is $9,964-$64,374 and its 30 day average price is $43,861.
Bitcoin [-3.68%] closed Tuesday’s daily candle in red figures at $47,714 for the first negative close in 3 days.
Quant Analysis
Quant continues to be the market’s most significant contrarian indicator – over the last few months, if the market is down, you can almost certainly expect QNT to be pumping.
Tuesday’s market conditions set up perfectly for that trend to continue, and Quant made new all-time high after new all-time high.
With just under 8 hours left in Tuesday’s daily candle, QNT broke its now-former ATH of $201.16, and the #57 cryptocurrency by market capitalization went parabolic.
Quant’s price cracked the former ATH and immediately ran up to test the next overhead Fibonacci level at $210.
As shown above, QNT flipped the former ATH as overhead resistance to support resistance. Below $200, bulls will want to hold the $180 level, or bears could send the price back to $149.14.
QNT has increased in price by 509% over the last 180 days [February 25th]. Over the previous 90 days, QNT is +348% against the U.S. Dollar, +263% against BTC, and +289% against ETH.
Quant’s 24-hour price range is $178-$210, and the 7-day price range is $170-$210. QNT’s 52-week price range is $6.69-$210, and its 30-day average price is $156.54.
QNT [+13.32%] closed Tuesday’s daily candle worth $205.89 and in green digits for the first time in four days.


