Bitcoin bullish
Bitcoin’s price action rallied during the last 4hr candle of the day to finish +.32% on Tuesday’s daily / monthly close. It was the first green candle close in four days on BTC.
Bitcoin’s 24 hour price range is $46,725-$48,244 and the 7 day price range is $46,725-$49,639. BTC’s 30 day average price is $45,739.
Today’s reading for the Fear and Greed Index is 71 and down 2 points from yesterday’s reading of 73 but still in the ‘Greed’ region of the metric.
What should market participants be looking at to determine the probability of what is coming next for bitcoin?
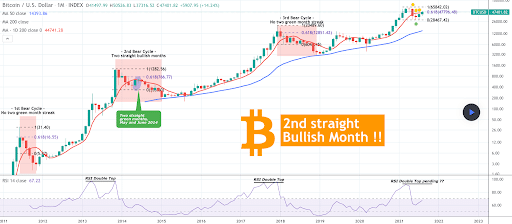
BTC’s monthly chart is telling an interesting story and yesterday’s monthly close was the second straight close on that timescale in green figures. As you can see on the chart below from TradingShot – in the history of bitcoin the asset’s never had back to back green monthly candles in a bear market.

Bitcoin bulls want to hold the $46,5k level in the interim but the price really won’t experience any technical damage until bears can push the price below $44k. If bears can take the price beneath $44k then the next level for bulls to hold is $40k
If bullish traders can finally breach the $50k level and get a significant close on an important time scale then $53k may be imminent in time.
Polkadot Analysis
Polkadot’s price action is beginning to pick-up at the right time if you believe the crypto sector’s cycles will continue. DOT was up more than 20% at times on Tuesday and broke the $30 threshold early on in its daily candle.
DOT’s price performance stacks up against the space’s titans over the last 30 days and illuminates the strength of DOT since it bottomed at $11.07 on July 20th.
Polkadot is +70.25% against the U.S. Dollar, +44.75% against BTC, and +27.38% against ETH for the last 30 days.
What’s ahead for DOT now that it’s on the right side of $30 for bullish traders?
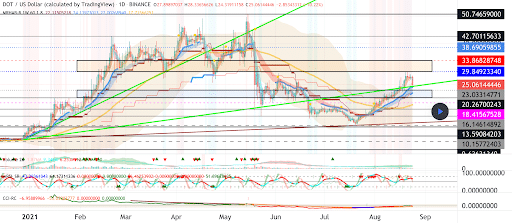
As you can see on the chart below from readCrypto DOT’s broken the $29 level that was acting as overhead resistance and ran to new highs for August.
The next target above $30 is the $35 level which may act as another zone of overhead resistance but $40 could be coming if the macro price action cooperates.

Bearish traders will want to get the price back below $30 and attempt to crack the $29 level to regain some momentum before bulls run away to the upside.
DOT’s 24 hour price range is $25.66-$32 and it’s 7 day price range is $23.90-$32. Polkadot’s 30 day average price is $23.67.
Polkadot closed Tuesday’s daily candle worth $31.37 and +20.49%.


