Summary
Bitcoin Analysis
Bitcoin bulls are fighting ferociously to hold the line at an important support resistance level of $46,5k. After selling off more than 20% at times on Tuesday the entire cryptocurrency sector now sort of waits for what the BTC price is going to do next since it very much still controls the macro outlook.
The fundamentals on bitcoin are just as sound as they were over the weekend before the big pullback and long-term bitcoiners are hardly phased over a 20% drop but where should traders expect the price to go next?
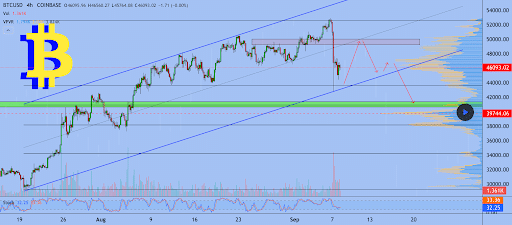
The below 4hr chart from EXCAVO posits that more downward pressure could be forthcoming for bitcoin. The upward sloping channel still has a bit of room left to the downside before it falls out of the structure but it’s looking like it could happen if bullish relief isn’t forthcoming shortly.

If the upward sloping channel is broken to the downside there’s support resistance for bulls at $41,000. Below that level $39,752 is the next stop for support resistance.
If bulls want to reclaim possession of the ball and make this a temporary reprieve from up only price action, bullish participants will want to get the price securely above $46,5k with a candle close on a significant timescale.
Above that level if bulls can regain control the next targets will be $50k and $53k which is where the BTC price just recently peaked.
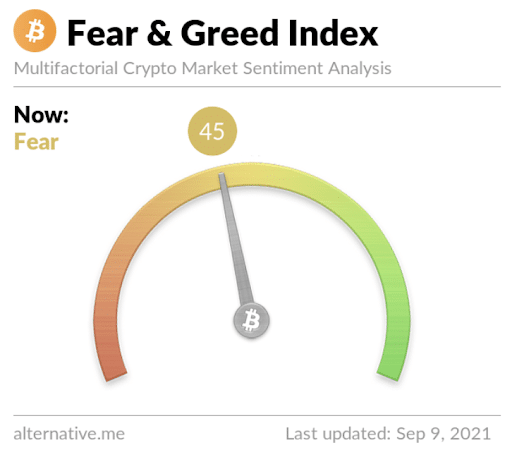
The Fear and Greed Index is reading 45 [Fear] and -2 from yesterday’s reading of 47 [Neutral].

BTC’s 24 hour price range is $44,318-$47,154 and the 7 day price range is $44,318-$52,774. Bitcoin’s 52 week price range is $10,220-$64,804.
The average bitcoin price for the last 30 days is $47,776.
Bitcoin [-1.48%] closed Wednesday’s daily candle worth $46,088 and in red figures for a second day in a row.
Cardano Price Analysis
Cardano’s price action over the last week has cooled off after really setting the pace of the Top 10 for much of the summer. ADA’s smart contract public mainnet launch is scheduled for September 12th and it appears market participants may be waiting to see how that pans out over the coming days.
So, what should traders expect strictly based on technical analysis and not the fundamentals like a smart contract platform launch?
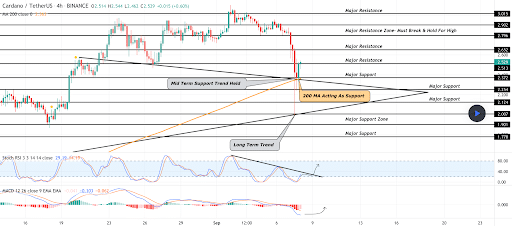
Strictly based on technical analysis Cardano is currently still securely above the 200 MA and bulls will want to hold this level in coming days to put an end to bearish momentum.

If bulls lose the 200 MA at $2.37 [at the time of writing] then the next stop is $2.25. If bears take that level then the next stop is $2.12 and if it doesn’t hold there’s not a lot looking left on the chart to suggest the price won’t fall to the next major support resistance sub $2 at $1.90.
If ADA bulls want a reversal to the upside and a continuation of the upward trajectory of over a year then they need to reclaim $2.50 and then take aim at $2.65 overhead.
The average ADA price for the last 30 days is $2.47.
ADA’s 24 hour price range is $2.22-$2.56 and the 7 day price range is $2.02-$3.09. Cardano’s 52 week price range is $.075-$3.09.
Cardano [-1.39%] closed Wednesday’s daily candle worth $2.46 and in red digits for the third straight day.


