Summary
Bitcoin Analysis
Bitcoin’s Monday price action saw a 24 hour low of $43,444 with traders wondering if a bottom is near or further downside is yet to come. BTC’s price action has been almost entirely downward since reaching a local top of $52,9k.
Since that local top was put in, the world’s premier digital asset has sputtered and is -13.2% for the last 7 days. September’s been a historically rocky month for BTC price action with positive momentum typically building after the month’s close to finish up the year – so traders are wondering if history will repeat again?
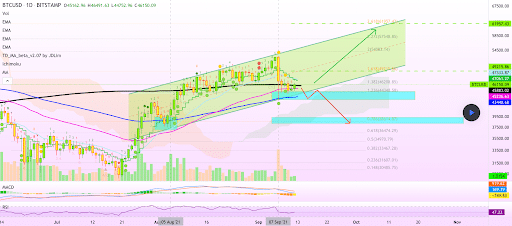
The below chart from AlanSantana posits that bulls could have their day again soon if they hold some important levels.
The chartist puts emphasis on the importance for BTC to hold its 200MA which corresponds with $45,9k at the time of writing. If bitcoin fails to hold this level and closes the weekly below the 200MA it could spell lower prices before any sustained reversal to the upside.
Below the 200MA the next support resistance for bulls to hold is $43k and if that fails to hold the chart suggests the $38,5k level is next.

The liquidation event that occurred a week ago today erased billions of dollars of over-leveraged long positions and now market participants must wait to see if a pivot is forthcoming.
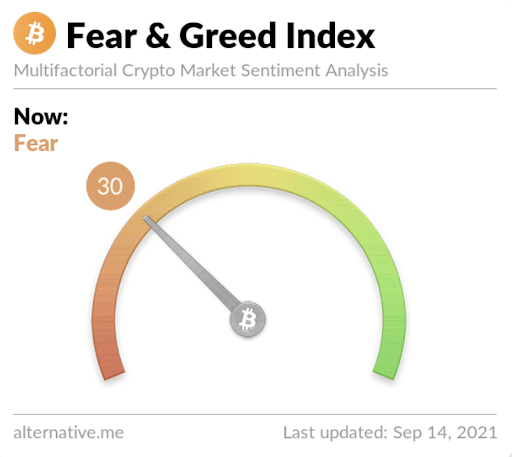
The Fear and Greed Index is at 30 and -14 from yesterday’s measurement of 44 while both levels are in the ‘Fear’ zone.

BTC’s 24 hour price range is $43,444-$46,874 and the 7 day price range is $43,444-$52,774. Bitcoin’s 52 week price range is $10,255-$64,804.
The average bitcoin price for the last 30 days is $47,764. BTC is +339.1% for the last 12 months against The U.S. Dollar.
BTC [-2.41%] closed Monday’s daily candle worth $44,960 and in red digits for the day.
Luna Analysis
Terra’s on a remarkable stretch over the last month but as we’ve seen recently with another alt-coin, Solana, that all vertical moves eventually come to an end.
So, is there more upside yet for Terra before a price correction occurs?
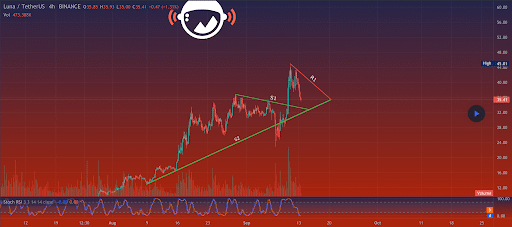
The chart below from MarsSignals shows Luna trading in the middle of a new range. There should be fairly decent support at the $32 level on the 4hr chart, that level’s been respected dating back to early August.
Traders will note that the trendline was broken briefly but could be labeled a scam wick down before the asset regained that trendline and then made a nice vertical move before another new all-time high.

If bulls can break the current structure again to the upside $50 may not be far off. On the contrary, if bears can break $32 to the downside they may be able to push the price to the mid $20 level.
Over the last 90 days Terra is +472.7% against The U.S. Dollar, +408.7% against BTC, and +339.4% against ETH over the same duration.
Luna’s 24 hour price range is $33.62-$39.62 and the 7 day price range is $25.85-$44.47. Luna’s 52 week price range is $4.08-$44.47.
Luna’s average price for the last 30 days is $30.35. Terra boasts a $15.1 billion market capitalization and is the #11 ranked project by market cap.
Luna [-5.22%] closed Monday’s daily candle worth $37.21 and in red digits. Terra closed the weekly timescale on Sunday in red digits also.


