Summary
Bitcoin Analysis
On Wednesday bitcoin’s price absorbed a brief rally before selling-off to begin the second leg of its daily candle.
BTC’s price managed to rally heading into the day’s final 4hr candle however and closed the day in positive figures.
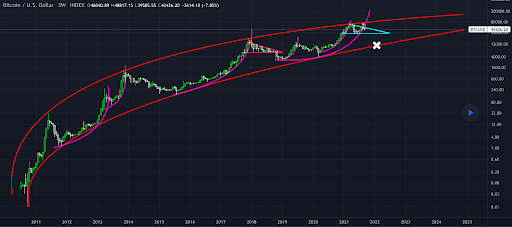
The chart below from BitFink shows just how dire times have gotten for bitcoin on the 3W timescale.
The chartist posits that if bids don’t start coming in, traders could find out that bitcoin’s in the early stages of a bear market and could take the price all the way down to test the $12k level.

Bitcoin bulls will hope to regain $43,6k first on the 4hr chart and avoid breaking down and falling below the $40k level. If bulls lose the $40k level it could be a quick trip back to test the $32k level. If bulls do test that region they’ll hope they bounce at $32k or double bottom at the $30k level.
On bitcoin’s 4hr chart BTC is making lower highs and then going back down to test $40,665. This has occurred numerous times and eventually the law of large numbers is in the favor of bears taking bulls into deep waters if the $40,665 level is tested and breached.
BTC is also bearishly engulfing on the monthly timescale with that candle closing today at 12:00 UTC.
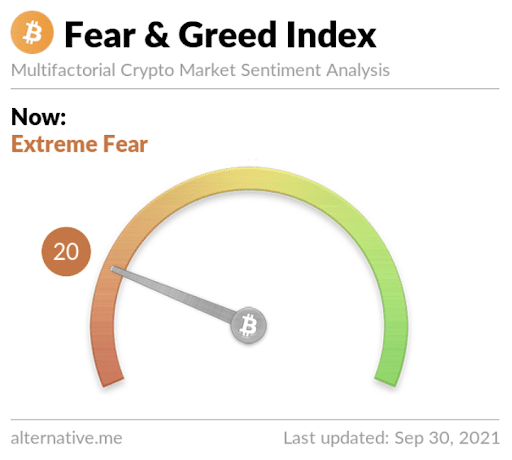
The Fear and Greed Index is 20 and in the Extreme Fear Zone of the metric. Today’s reading is -4 from Wednesday’s reading that was 24 and also in the Extreme Fear Zone.

BTC’s 24 hour price range is $40,984-$42,648 and it’s 7 day price range is $40,930-$45,167. BTC’s 52 week price range is $10,476-$64,804.
Bitcoin’s price was $10,770 on this date last year.
BTC’s 30 day average price is $45,945.
Bitcoin [+1.19%] closed Wednesday’s daily candle worth $41,551.
Ethereum Analysis
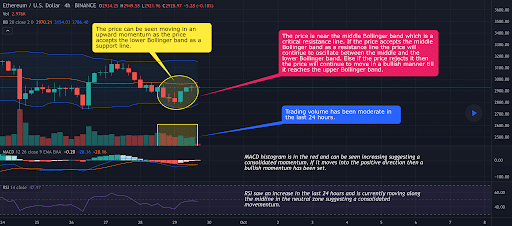
Ether’s price is currently testing the bottom of its bollinger bands on the 4hr timescale. This could be a critical support resistance for bulls to hold at $2,6k which is the bottom of the bands, at the time of writing.
If ETH bulls want to take control of the price again their primary target is $3k with a secondary target of $3,165.

Any price action below the $2,6k level is a serious threat to any chance of Ether bulls continuing a multi-year bull cycle.
ETH’s 24 hour price range is $2,795-$2,948 and it’s 7 day price range is $2,750-$3,178. Ether’s 52 week price range is $337.42-$4,352.11.
Ether’s price on this date last year was $359.60.
ETH’s 30 day average price is $3,331.
Ether [+1.57%] closed Wednesday’s daily candle worth $2,851 in green digits, breaking a two day streak of red daily candle closes.
Chainlink Analysis
Since LINK made its all-time high on May 10th of $52.70 its price is -57.6%, at the time of writing.
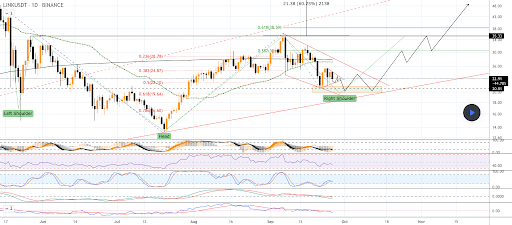
The 1D LINK / USDT chart below from CFcryptoTA shows an inverse head and shoulders with the pattern completion zone potentially sending LINK’s price to $18.95.

If bears can break the $18.95 level to the downside then LINK traders could be looking at an extended bear market.
Chainlink bulls need to retest the $26 level. If bullish traders can flip the $26 level back to support resistance then the first target is $30, followed by a secondary target of $35.33.
LINK’s 24 hour price range is $22.29-$23.86 and its 7 day price range is $21.85-$25.48. Chainlink’s 52 week price range is $8.57-$52.70.
LINK’s price on this date last year was $9.85.
Chainlink’s 30 day average price is $27.08.
LINK [+3.25] closed Wednesday’s daily candle worth $22.84 and in green digits for the first time in three days.


