Summary
Bitcoin (BTC) Analysis
Bitcoin’s price action on the new week was bearish for its first 12 hour candle but flipped bullishly and received an afternoon price rally that extended into Monday’s close with bullish bidders apparently back on the scene.
Traders will be watching bitcoin’s price action closely as it’s been respecting the $47k level as support resistance with a 24 hour low of $47,045.
The 1D BTC chart below from hardforky brings a different perspective in log scale and shows just how important this re-test of the $50k-$53k level is for a breakout.
Within the log scale BTC is in a large range still between $32,410-$53k.
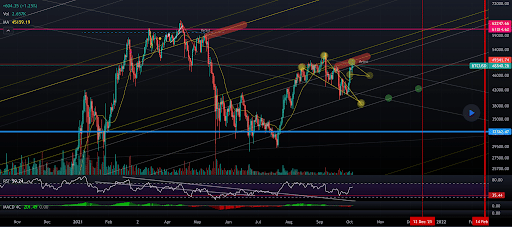
If bulls can break $53k and make a higher high than $53k then bitcoin’s bull cycle is indeed ongoing. Conversely, if bears can hold the line at $50k-$53k and reverse price action bitcoin could be confirming that $64,804 was the top of the most recent cycle.
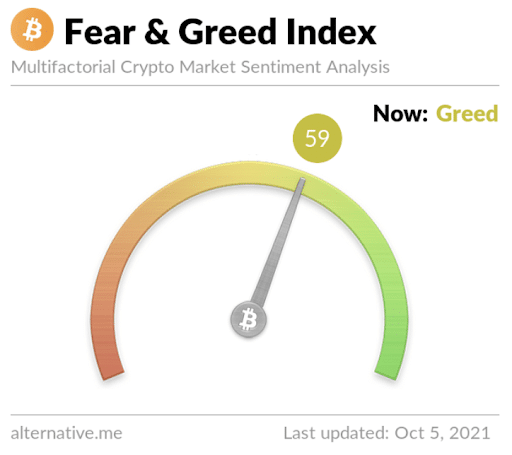
The Fear and Greed Index is 59 [Greed] and +5 from Monday’s reading of 54 [Neutral].
BTC’s 24 price range is $47,188-$49,523 and the 7 day price range is $41,002-$49,523. Bitcoin’s 52 week price range is $10,577-$64,804.
BTC was worth $10,605 on this date last year.
Bitcoin’s 30 day average price is $45,908.
BTC [+2.09%] closed Monday’s daily candle worth $49,252 and in green digits for the second consecutive day.
Ethereum Analysis
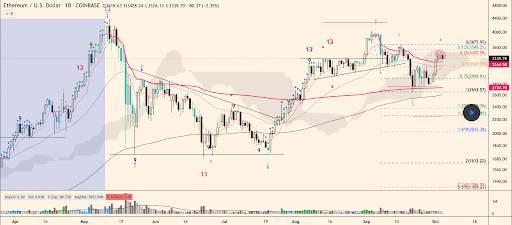
As I noted in yesterday’s article Ether bulls are once again attempting to break down the door that is $3,5k. Above the $3,5k price level bulls are in charge of ETH’s price action. Below $3,5k between $3k-$3,5k it appears neutral.
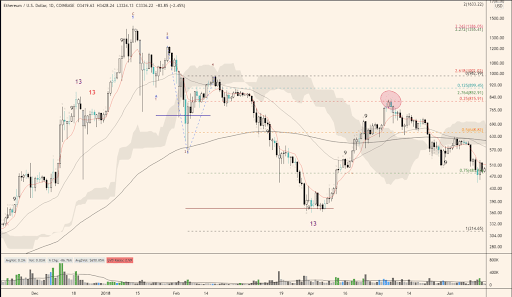
There are two ETH 1D charts below from kidze. The top chart is the current 1D chart for Ether and the second is from the 2017 / 2018 ETH bull cycle and may be something that traders are considering in the short-term.
If the top chart plays out like the prior bull cycle’s chart then ETH’s already put in its bull cycle high.
Ether’s 24 hour price range is $3,299-$3,437 and the 7 day price range is $2,801-$3,474. ETH’s 52 week price range is $337.42-$4,352.11.
ETH’s price on this date last year was $340.62.
Ether’s average price for the last 30 days is $3,275.
ETH [-0.97%] closed Monday’s daily candle worth $3,383 and in red digits breaking a streak of 5 straight daily closes in green digits.
Solana Analysis
If you’re a bullish trader Solana continues to set the pace for projects heading in the right direction.
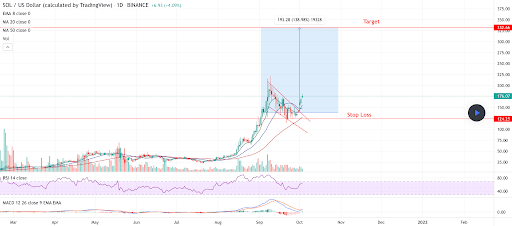
The chart above from Crypto_Masters shows that Solana’s broken out of its bull flag on the daily chart after 3 weeks of consolidation.
The chartist posits a good stop loss for traders is at $124 which is just below Solana’s low during the most recent downtrend. The chartist adds that a profit taking level may be the current ATH of $213.47 and above that level at $332 over time which could be the pattern completion zone.
Solana’s 24 hour price range is $164.17-$172.16 and the 7 day price range is $129.85-$176.97. SOL’s 52 week price range is $1.03-$213.47.
SOL’s price on this date last year was $2.17.
Solana’s 30 day average price is $156.4.
Solana [-3.4%] closed Monday’s daily candle valued at $167.1 and broke a streak of 5 prior green daily candle closes in a row.


