

Summary
Bitcoin Analysis
Bitcoin’s price traded sideways in a tight range for the weekend and back-tested the former rally high of $53k successfully. Sunday’s close saw BTC’s price finish -$399 for the week.
The 1D BTC chart below from theLeo_Crypto is one scenario that might play out for bullish traders if BTC breaches its ATH of $64,804.
It’s crucial for bullish traders to continue to hold the $53k level as support resistance and knock down the door on $55k and hold it as support resistance next.
On the daily timescale the next substantial overhead resistance is $63k. For bears their primary target is to send the price to $53,007 and then push BTC’s price down to the $50,774 level.
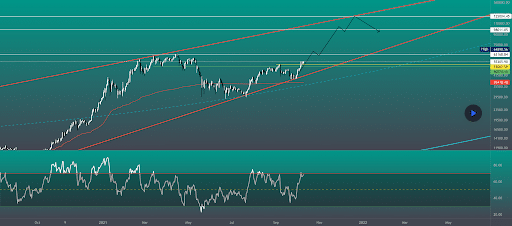
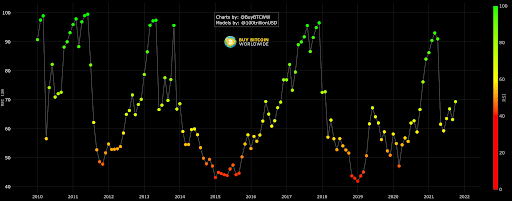
BTC’s Relative Strength Index is at its highest level [69.33] since its decline began at the beginning of Q2 of this year [93.55].
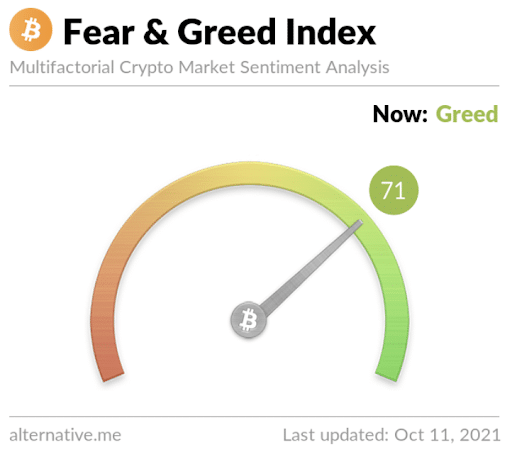
The Fear and Greed Index is 71 Greed and equal to Sunday’s reading.
BTC’s 24 hour price range is $54,302-$56,715 and its 7 day price range is $47,227-$56,715. Bitcoin’s 52 week price range is $11,268-$64,804.
Bitcoin’s price on this date last year was $11,543.
BTC’s average price for the last 30 days is $47,219.
On Sunday, bitcoin closed its daily / weekly candle worth $54,701 and in red figures for the daily timescale [-0.50%]. BTC closed the weekly timescale in red figures as well and -0.39%.
Ethereum Analysis
Ether’s price action continues to flirt with the $3,5k level and ETH bulls again failed to close above that critical level on the weekly timescale on Sunday.
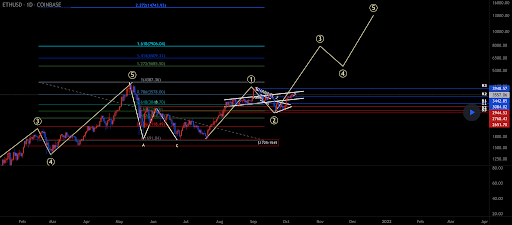
The ETH 1D chart below from Legacycreatorsuk shows what could be forthcoming for traders if BTC and the macro price action allow Ether to continue its 18 month bull trend.
ETH’s 24 hour price range is $3,412-$3,605 and its 7 day price range is $3,304-$3,668. Ether’s 52 week price range is $365.41-$4,352.11.
Ether’s price on this date last year was $374.5.
ETH’s average price for the last 30 days is $3,269.
Ether [-4.46%] closed its daily candle on Sunday worth $3,414. ETH closed the weekly timescale -4.11%.
Polkadot Analysis
Polkadot’s price action continues to pace the top alt coins across the space while BTCD continues to build.
The 1D DOT chart below from ekoajiw shows DOT heading back to the middle of its ascending channel and the 1.414 fib level.
Now that DOT’s flipped the $30 level to support resistance again, the next target for bullish DOT traders is $44 with a secondary target of $60.
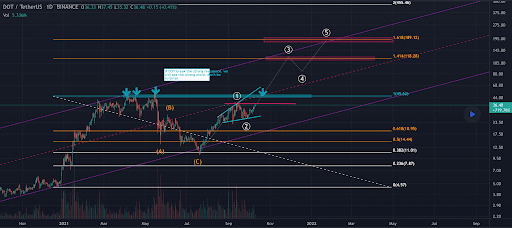
Conversely, DOT bears will try to again send the price below $30 with a primary target of $23.5 and a secondary target of $18.95 [0.618 fib level].
DOT’s 24 hour price range is $34.34-$37.42 and its 7 day price range is $29.48-$37.42. Polkadot’s 52 week price range is $3.91-$49.35.
Polkadot’s price on this date last year was $4.25.
DOT’s 30 day average price is $32.12.
Polkadot closed its daily / weekly candle on Sunday worth $34.43. DOT closed the daily timescale -5.18% and the weekly timescale -4.30%.