Summary
Bitcoin Analysis
Bitcoin traded in green figures on Sunday and the space’s number one asset finished its daily candle +$644. Despite putting in a session low of $59,2k on Sunday, bitcoin rallied during the day’s final 4hr candle and that momentum carried into the beginning of the new week.
Bitcoin is +101.3% for the last 90 days and +448% for the last 365 days, at the time of writing.
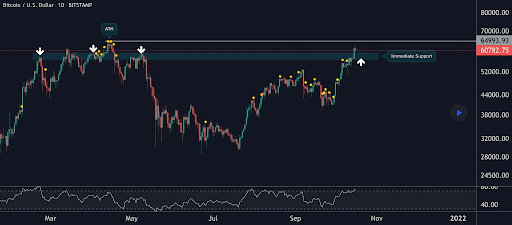
The 1D BTC chart below from PolarHusk shows strong support resistance at the $58k level for bulls with overhead resistance just 5.9% away to make a new BTC all-time high.

BTC’s 24 hour price range is $59,228-$62,045 and its 7 day price range is $54,767-$62,688. Bitcoin’s 52 week price range is $11,451-$64,804.
BTC’s price on this date last year was $11,495.
The average bitcoin price over the last 30 days is $40,528.
Bitcoin closed its daily / weekly candle worth $61,511. BTC closed its daily candle +1.06%.
Ethereum Analysis
Ether’s price action over the last 7 days has been controlled by Ether bulls and they’ve pushed the price +6% over that duration.
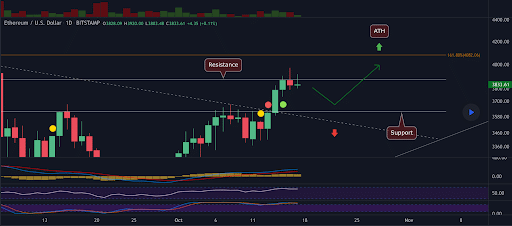
The chart below from DU09 lays out a scenario where Ether drops to the $3,6k level yet again and one last time before using that level as a spring to test ETH’s current ATH of $4,356.

Ether is also trading above all of the major moving averages of importance, at the time of writing.

ETH’s 24 hour price range is $3,697-$3,923 and its 7 day price range is $3,426-$3,959. Ether’s 52 week price range is $368.56-$4,356.99.
Ether’s price on this date last year was $378.05.
The average Ether price for the last 30 days is $3,348.65.
ETH closed its daily / weekly candle worth $3,844.63. Ether closed its daily candle +.43% on Sunday.
Polkadot Analysis
Polkadot’s fundamentals are as solid as they’ve been in possibly the entirety of the project’s 4 year existence and now the technicals could be aligning at the perfect moment for bullish DOT traders.
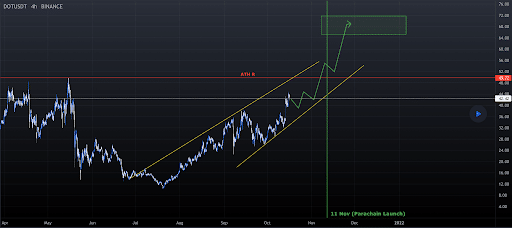
The 4hr DOT chart below from CryCodoin illuminates the strength of DOT’s ascending channel dating back to the middle of June.
The chartist posits that with the launch of Parachains on Polkadot’s network on November 11th that DOT’s price could be prepping to mark up considerably. The first target on the chart below is $65 with $73 as a secondary target for bulls.

For DOT bears they’ll need to send the price below $40 and get a candle close below that level on a significant time frame. If they want an extended rally to the downside, bears will then need to send DOT’s price to the $36 level and break the long time trend on the 4hr chart.
DOT’s 24 hour price range is $40.11-$42.89 and its 7 day price range is $32.31-$44.41. Polkadot’s 52 week price range is $3.91-$49.35.
DOT’s price on this date last year was $4.11.
Polkadot’s 30 day average price is $33.47.
DOT closed its daily / weekly candle worth $42.10. Polkadot closed its daily candle +1.02% on Sunday.


