Summary
Bitcoin inflection point
Bitcoin’s price backtested a breakout of $64,8k on Monday that occurred right before Sunday’s daily / weekly candle close. BTC’s price failed to hold that inflection point and finished Monday with a bearish engulfing candle and -$1,909.
The BTC/USD 1D chart below from Mrcryptotracker illuminates the gravity of the current situation on the daily time frame. Bitcoin bulls really need to again send the price above this pattern and break out to the upside or bears may get their hope to revisit $55k.
Bitcoin bears are currently enjoying the battle over BTC’s RSI and bitcoin’s volume hasn’t been supporting bullish impulses to higher prices yet. The combination of BTC’s current rising wedge [with a false breakout,] a relatively weak RSI and a decline in volume certainly has made things interesting from the perspective of bulls and bears alike.
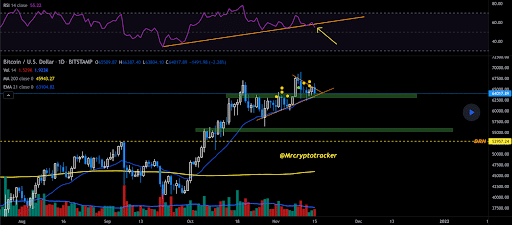
One other area to monitor closely by market participants is the $63,588 level [a former BTC ATH] that’s held 5 out of the last 6 days and is an important level of inflection on the BTC/USD 4hr chart.
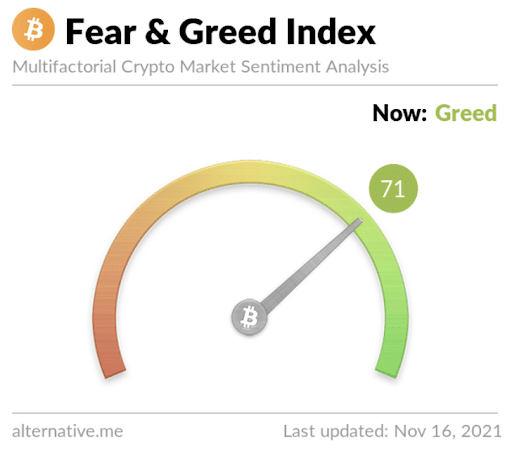
The Fear and Greed Index is 71 Greed and -1 from yesterday’s reading of 72 Greed.
BTC’s 24 hour price range is $63,562-$66,359 and its 7 day price range is $63,091-$68,640. Bitcoin’s 52 week price range is $15,906-$69,044.
The price of bitcoin on this date last year was $15,984.
The average price of BTC for the last 30 days is $62,686.
Bitcoin [-2.92%] closed its daily candle worth $63,562 and in red figures for the first time in three days.
Ethereum Analysis
Ether’s price is in a similar battle at the $4,5k level to bitcoin’s price at the levels described above. Bullish Ether traders are clinging to support and ETH finished the day -$62.72.
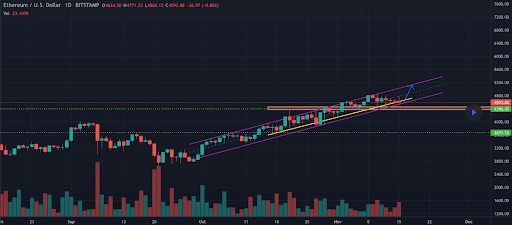
The ETH/USD 1D chart below from miguelnavarrocaro shows Ether’s price currently respecting its trendline on the daily time frame. This trendline dates back to late October and other than a few brief impulse candles down, ETH’s price has traded above this trendline since.
With so much consolidation in this relatively tight ascending channel, Ether bulls will hope the next move is another bounce from the bottom of this trend to the top. If bulls do send the price higher, the top of the channel will correspond with an Ether price of at the $5k level.
Of course, bearish ETH traders are trying to break that trendline to the downside and send ETH’s price back below the $4,5k level. Bears will need to send it out of the ascending channel to the downside with a breakout of the pattern below the $4,6k level.
ETH’s 24 hour price range is $4,543-$4,770 and its 7 day price range is $4,528-$4,849. Ether’s 52 week price range is $448.17-$4,878.
The price of ETH on this date in 2020 was $449.21.
The average price of ETH for the last 30 days is $4,320.
Ether [-1.36%] closed its daily candle on Monday worth $4,563 and in red figures for the fourth straight day. Ether’s price has also finished 17 out of the last 29 daily candles in red figures.
VeChain Analysis
VET’s price started Monday’s daily candle on a very positive note and was +5% on the day at times but finished in green digits by a slim margin [+.61%].
The VET/USD 1D chart below from btgraph shows the targets overhead for VeChain bulls on the daily time frame. VET is bumping up against the closest overhead resistance [at the time of writing] at the 0.618 fib extension level [$.1731] and a secondary target for bulls above at the 0.786 fib extension level[$.22]. The last obstacle for bulls above $.22 before another trip into price discovery is VET’s all-time high of $.28.
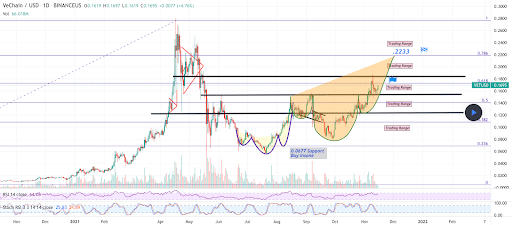
Over the last 12 months VET is +1,434% against The U.S. Dollar, +279.2% against BTC, and +48.48% against ETH.
VeChain’s 24 hour price range is $.156-$.177 and its 7 day price range is $.154-$.186. VET’s 52 week price range is $.01-$.28.
VET’s price on this date last year was $.011.
The average price for VET over the last 30 days is $.142.
VeChain [+0.61%] closed its daily candle on Wednesday worth $.162 – it was VET’s third straight daily close in green digits.


